AI-powered search & chat for Data / Computer Science Students
What is t-SNE?
t-SNE ( t-Distributed Stochastic Neighbor Embedding) is a technique that visualizes high dimensional data by giving each point a location in a two or three-dimensional map. The technique is the…
Read more at Analytics Vidhya
t-SNE clearly explained
An intuitive explanation of t-SNE algorithm and why it's so useful in practice.
Read more at Towards Data Science
What, Why and How of t-SNE
Imagine the data we create in a single day; the news generated, posts, videos, images on social media platforms, messages on communication channels, websites which help business and many more… Huge…
Read more at Towards Data Science
Revealing the Magic Behind t-SNE
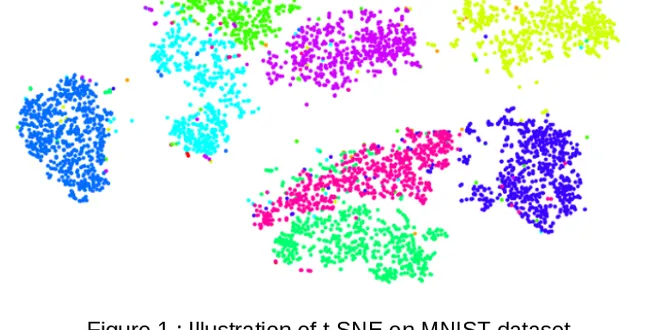
What you see below is a 2D representation of the MNIST dataset, containing handwritten digits between 0 and 9. It was produced by t-SNE, a fully unsupervised algorithm. Data in real-life applications…...
Read more at Towards Data Science
t-SNE: Behind the Math
Being one of the most talked about dimensionality reduction algorithms in the recent years, especially for visualizations, I thought I’d take some time to help others develop an intuition on what…
Read more at Towards Data Science
Why You Are Using t-SNE Wrong
t-SNE has become a very popular technique for visualizing high dimensional data. It’s extremely common to take the features from an inner layer of a deep learning model and plot them in 2-dimensions…
Read more at Towards Data Science
T-SNE INTUITION
Like PCA, t-SNE, or t-distributed Stochastic Neighborhood Embedding, is a visualization and dimensionality reduction algorithm. However, unlike PCA, t-SNE is a highly advanced State of the Art (SOTA)…...
Read more at Analytics Vidhya
Formulating and Implementing the t-SNE Algorithm From Scratch
Today, you will learn every detail about t-SNE! I am excited to introduce you to Avi Chawla! He is an exceptional Data Scientist and Data Science content creator, and in this guest post, he presents t...
Read more at The AiEdge Newsletter
t-SNE Python Example
t-Distributed Stochastic Neighbor Embedding (t-SNE) is a dimensionality reduction technique used to represent high-dimensional dataset in a low-dimensional space of two or three dimensions so that we…...
Read more at Towards Data Science
How to Use t-SNE Effectively
Although extremely useful for visualizing high-dimensional data, t-SNE plots can sometimes be mysterious or misleading. By exploring how it behaves in simple cases, we can learn to use it more effecti...
Read more at Distill
t-SNE from Scratch (ft. NumPy)
Cover Image by Author Acquire a deep understanding of the inner workings of t-SNE via implementation from scratch in python I have found that one of the best ways to truly understanding any statistica...
Read more at Towards Data Science
An Introduction to t-SNE with Python Example
I’ve always had a passion for learning and consider myself a lifelong learner. Being at SAS, as a data scientist, allows me to learn and try out new algorithms and functionalities that we regularly…
Read more at Towards Data Science
Understanding t-SNE by Implementation
How does t-SNE Work and How It Can be Implemented Image by author. In this blog post we will look into inner workings of the t-SNE algorithm, to clearly understand how it works, what it could be used...
Read more at Towards Data Science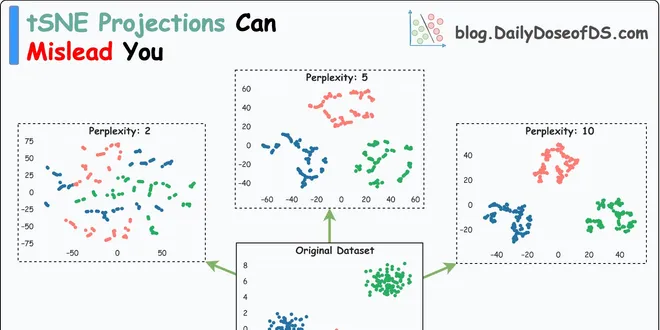
How To Avoid Getting Misled by t-SNE Projections?
t-SNE is among the most powerful dimensionality reduction techniques to visualize high-dimensional datasets. In my experience, most folks have at least heard of the t-SNE algorithm. In fact, do you kn...
Read more at Daily Dose of Data Science
Understanding t-SNE in Python
Grouping data looking at neighbors and using T-Distribution SNE Continue reading on Towards Data Science
Read more at Towards Data Science
tSNE simplified
Guys, to tell you the truth when I heard the name tSNE and the full form being t-distributed stochastic neighborhood embedding, I was scared. Gradually, I could find my way through the papers…
Read more at Towards Data Science
Implementing T-SNE in Tensorflow [ Manual Back Prop in TF ]
Today, I just wanted to study about t-Distributed Stochastic Neighbor Embedding (t-SNE), and wanted to implement it in tensorflow while creating some visualizations. Below are the cases that we are…
Read more at Towards Data Science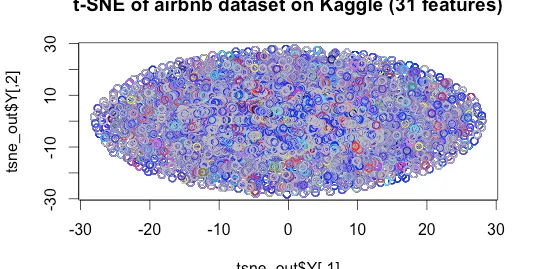
Visualize multi-dimension datasets in a 2D graph using t-SNE (Airbnb bookings dataset as example)
First of all, what is t-SNE and when and why are we using it? It is an unsupervised and non-linear dimension reduction algorithm, people usually use it during exploratory data analysis, an early…
Read more at Analytics Vidhya
Using t-SNE for Data Visualisation
The purpose of this article is not to teach how t-SNE (t-distributed stochastic neighbor embedding) works, but how you could use it to help you visualising data. The main idea behind t-SNE is that it…...
Read more at Analytics Vidhya
Mapping the tech world with t-SNE
This post is part of our mini-series presenting the results of our latest analysis of technology news. We have two main goals: Our text mining exercises are based on a technology news data set that…
Read more at Towards Data Science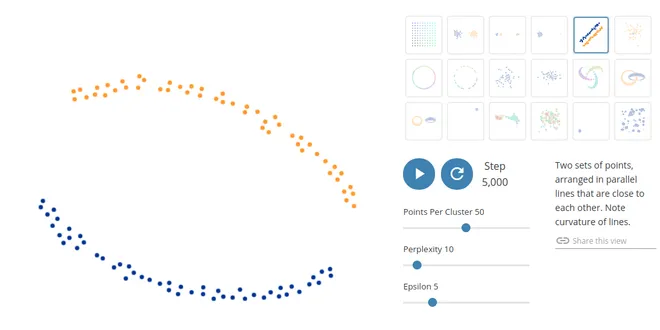
T-SNE (Geometric Intuition)
T-SNE stands for geometric T distributed Stochastic Neighbourhood Embedding. This is one of the state of art for dimensionality reduction especially for visualization of data. T-SNE is one of the…
Read more at Analytics Vidhya
Geometric Intuition of T-SNE
In last article I have covered about dimension reduction and geometric intution of PCA(Prinicipal Component Analysis) (for now just remember that t distribution or student’s t distribution was…
Read more at Analytics Vidhya
t-SNE: The effect of various perplexity values on the shape
t-SNE: The effect of various perplexity values on the shape An illustration of t-SNE on the two concentric circles and the S-curve datasets for different perplexity values. We observe a tendency towar...
Read more at Scikit-learn Examples
Plotting text and image vectors using t-SNE
John Micternan rightly pointed out that ‘In presentation lies the true entertainment’, and if you can present your data in a way the other guy wished, he would be in a state of bliss. Imagine a world…...
Read more at Towards Data Science- «
- ‹
- …