AI-powered search & chat for Data / Computer Science Students

How to Bin Numerical Data with Pandas
Discretise numerical variable with Pandas between, cut, qcut and value counts Continue reading on Towards Data Science
Read more at Towards Data Science
Is Binning in Data Analysis a Good Idea?
Data analysis is a very important part of the data scientist’s job. Because I am not actually employed by a company as a data scientist, I must acquire my skills by taking courses or entering…
Read more at Python in Plain English
Feature Engineering: Bayesian Methods for Binning
One of the most crucial pieces of any data science puzzle is perhaps also the least glamorous: feature engineering. It can be protracted and frustrating, but if it’s not done right, it can spell…
Read more at Towards Data Science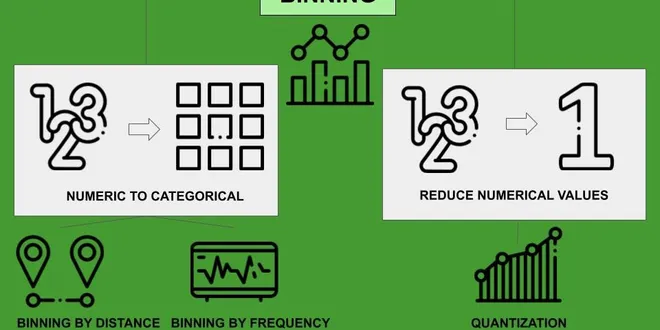
Data Preprocessing with Python Pandas — Part 5 Binning
Data binning (or bucketing) groups data in bins (or buckets), in the sense that it replaces values contained into a small interval with a single representative value for that interval. Sometimes…
Read more at Towards Data Science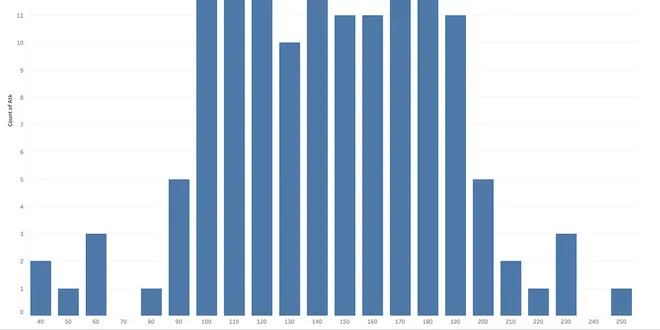
Data Scientists: STOP Randomly Binning Histograms
Histograms are a crucial part of Exploratory Data Analysis. But we often abuse them by randomly choosing a number of bins. Let’s use math.
Read more at Analytics Vidhya
Binning for Feature Engineering in Machine Learning
If you have trained your model and still think the accuracy can be improved, it may be time for feature engineering. Feature engineering is the practice of using existing data to create new features…
Read more at Towards Data Science
From Numerical to Categorical
Three ways to bin numeric features Photo by frank mckenna on Unsplash Binning numerical features into groups based on intervals the original value falls into can improve model performance. This can o...
Read more at Towards Data Science
Data Binning with Pandas Cut or Qcut Method
Binning the data can be a very useful strategy while dealing with numeric data to understand certain trends. Sometimes, we may need an age range, not the exact age, a profit margin not profit, a…
Read more at Towards Data Science
Feature Engineering Examples: Binning Numerical Features
Feature engineering focuses on using the variables already present in your dataset to create additional features that are (hopefully) better at representing the underlying structure of your data. For…...
Read more at Towards Data Science
Optimal Break Points for Histograms with {healthyR}
Introduction Histogram binning is a technique used in data visualization to group continuous data into a set of discrete bins, or intervals. The purpose of histogram binning is to represent the distri...
Read more at R-bloggers
Feature Engineering Examples: Binning Categorical Features
Working with categorical data for machine learning (ML) purposes can sometimes present tricky issues. Ultimately these features need to be numerically encoded in some way so that an ML algorithm can…
Read more at Towards Data Science
Histograms, Binnings, and Density
A simple histogram can be a great first step in understanding a dataset. Earlier, we saw a preview of Matplotlib's histogram function (see Comparisons, Masks, and Boolean Logic ), which creates a basi...
Read more at Python Data Science Handbook
Automate Your Histograms
Ways to automatically select the number of bins Continue reading on Towards Data Science
Read more at Towards Data Science
How I customarily bin data with Pandas
Master the when and how of Pandas qcut and cut. Learn about their differences and their usage in real-life setting
Read more at Towards Data Science
On the statistical analysis of rounded or binned data
On the Statistical Analysis of Rounded or Binned Data Sheppard’s corrections offer approximations, but errors persist. Analytical bounds provide insight into the magnitude of these errors Photo by ch...
Read more at Towards Data Science
Essential guide to perform Feature Binning using a Decision Tree Model
Feature Engineering is an essential component of a machine learning model development pipeline. A machine learning model understands only numerical vectors, so a data scientist needs to engineer the…
Read more at Towards Data Science
Histograms and frequently table in python an approximation to the selection of the number of bins
A very common way to explore a variable is by means of a histogram. However, before teaching you how to build it, it is important to explain the concept of a frequency table, since it is closely…
Read more at The Pythoneers
3 Best (Often Better) Histogram Alternatives | Avoid Binning Bias
Learn best alternatives to histograms such as Probability Mass Functions, Probability Density, and Cumulative Distribution Functions. Also, learn about the binning bias of histograms and how to avoid ...
Read more at Towards Data Science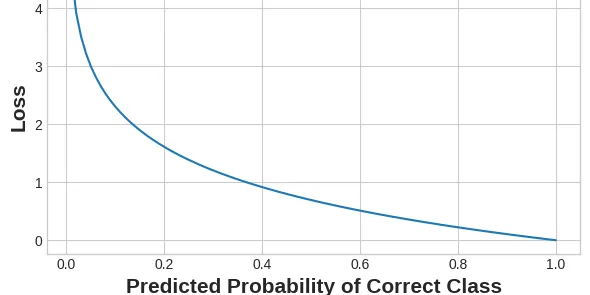
Binary Classification
Introduction So far in this course, we've learned about how neural networks can solve regression problems. Now we're going to apply neural networks to another common machine learning problem: classif...
Read more at Kaggle Learn Courses
SQL Series: Categorization, Encoding & Binarization — Step by Step
SQL Series: Categorization, Encoding & Binarization — Step by Step SQL from Scratch to Data Science 3.1 by Copywriter and Ghostwriter Sarah Bulhões In the preceding chapters, we have explored the def...
Read more at Level Up Coding
Histogram Matching
Before start defining the histogram, for simplicity, we use grayscales images. Then later I explain the process for the color images as well. The image histogram indicates the intensity distribution…
Read more at Towards Data Science
Understanding Binary Data
In this post I’m explaining data as it truly exists in our computers. If you’ve ever wondered how a sequence of 1 and 0 results in meaningful information, this article is for you. All data in a…
Read more at Towards Data Science
Goodbye Scatterplot, Welcome Binned Scatterplot
How to visualize and do inference on conditional means Image by Author When we want to visualize the relationship between two continuous variables, the go-to plot is the scatterplot. It’s a very intu...
Read more at Towards Data Science
Histograms, Why & How
Why: a histogram is a graphical representation of the distribution of a dataset. Although its appearance is similar to that of a standard bar graph, instead of making comparisons between different…
Read more at Towards Data Science- «
- ‹
- …