AI-powered search & chat for Data / Computer Science Students

Getting started with Visualizations in Python
Visualizing anything gives us a better understanding, a holistic picture of things, be it the monthly turn over of your company, the increasing temperature, or even tensed situations where you could…
Read more at Towards Data Science
Data Visualization with Python
Data visualization is a visual (or graphic) representation of data to find useful insights (i.e. trends and patterns) in the data and making data analysis easier.
Read more at Towards Data Science
Data Visualization Using Python
Matplotlib For Beginners Photo by Марьян Блан | @marjanblan on Unsplash While talking to a lot of aspiring analysts/ data scientists, I realized that their only focus/ interest is towards learning pr...
Read more at Towards Data Science
How to do visualization using python from scratch
Visualization is an important skill set for a data scientist. A good visualization can help in clearly communicating insights identified in the analysis also it is a good technique to better…
Read more at Towards Data Science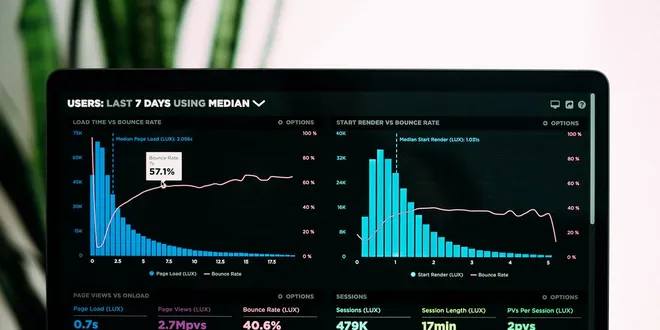
Visualization in Python — Matplotlib
Visualizing data is an important know-how for any data scientist or analyst to have. This gives a better idea of what the data looks like, allows to detect patterns or the presence of outliers etc…
Read more at Towards Data Science
How To: Visualize Your Data in Python
Any data related problem can be split into three steps: getting and cleaning the data, visualizing and analysis, and then interpreting the analysis to verify (or refute) a claim. So far, we’ve…
Read more at Analytics Vidhya
The Basics of Data Visualisation with Python
Learn to create a Line Plot, a Bar Chart, Heat Map and a Pie Chart with Python in under 3 minutes
Read more at Towards Data Science
Creating Visualizations with Python!
Here’s a brief overview of how to use these libraries to create visuals for data analysis Continue reading on Python in Plain English
Read more at Python in Plain English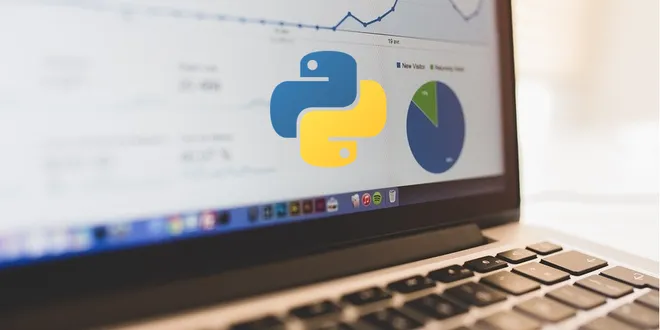
Your Ultimate Python Visualization Cheat-Sheet
This cheat-sheet contains the elements of a plot you will most commonly need in a clear and organized fashion, with code and examples. Before you create any plot, it is recommended to scroll through…
Read more at Towards Data Science
How to Make Basic Visualizations in Python without Coding
Visualizations such as boxplots, histograms, and bar plots help us explore and have a better understanding of our data. However, creating plots with Seaborn or Pandas might take a lot of time (let…
Read more at Towards Data Science
A simple guide to Data visualization with Python , Part 1
Python has two popular libraries for creating visualizations namely — Matplotlib and Sea-born. In this post, I will discuss about some basic plots that can be created using the Matplotlib library and…...
Read more at Analytics Vidhya
Data Visualization with Python
Why Data Visualization Matters: Data visualization plays a crucial role in the data analysis process by helping analysts: Identify patterns and trends in the data. Communicate insights and findings to...
Read more at Python in Plain English
Beginner’s Guide to Visualizations with Matplotlib
Getting Started with Data Visualization Image by Adegboyega Aare If you’ve recently delved into the fascinating world of data visualization, let me tell you about Matplotlib, a tool that has become m...
Read more at Python in Plain English
Data Visualization with Matplotlib
Matplotlib is a comprehensive library for creating static, animated, and interactive visualizations in Python. It is said that “Matplotlib makes easy things easy and hard things possible”. It is a…
Read more at Analytics Vidhya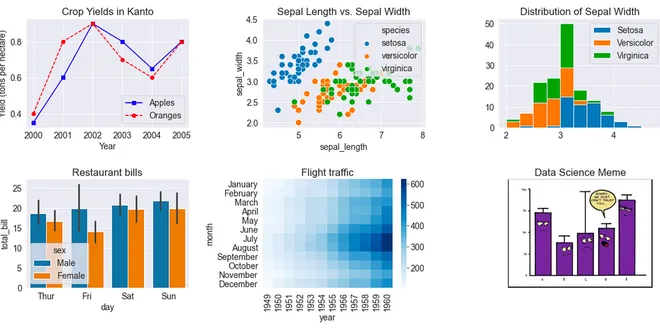
Data Visualization with Python
Using Python libraries Matplotlib and seaborn to apply some popular data visualization techniques. credits: jovian.ai Data visualization is an essential part of data analysis. Here we will use Python...
Read more at Python in Plain English
Data Visualization with Python Matplotlib Library
Installing Matplotlib Before we dive in, make sure you have Matplotlib installed. You can install it using pip : Basic Line Plot Create a simple line plot to visualize a dataset: Customizing Plots Tai...
Read more at Python in Plain English
A Simple Guide to Beautiful Visualizations in Python
You’re in the middle of a project and suddenly you need to make a plot to analyze the data or present the insights found. You don’t have too much time, but you definitely don’t want to create a plot…
Read more at Towards Data Science
How to Create Interactive Visualisations in Python
Learn to build interactive charts with plotly express. Learn to apply Range Sliders, Custom Buttons and Range Filter!
Read more at Towards Data Science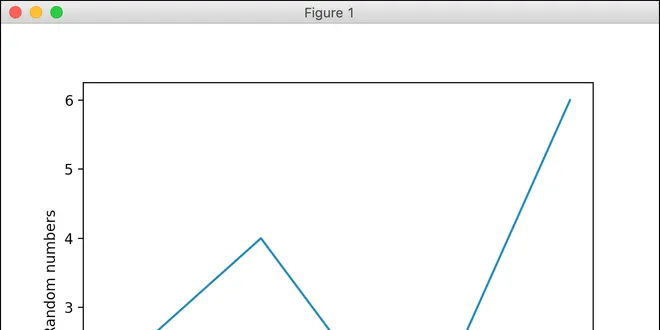
Matplotlib - An Intro to Creating Graphs with Python
Data visualizations are an important method of sharing your data with others. Some people refer to visualizations as plots, charts, or graphs. These names are synonymous in this article. Python has ma...
Read more at Mouse Vs Python
Data Visualization Techniques in Python
Data visualization involves representing data in graphical or pictorial formats, making it easier for users to understand complex information. Python offers several libraries for data visualization, i...
Read more at Python in Plain English
Visualization with Matplotlib
Matplotlib is the most widely used Python library for various visualizations: static, dynamic, or animated. Today, we will learn how to plot data using this library in Python. Histograms are one of…
Read more at Level Up Coding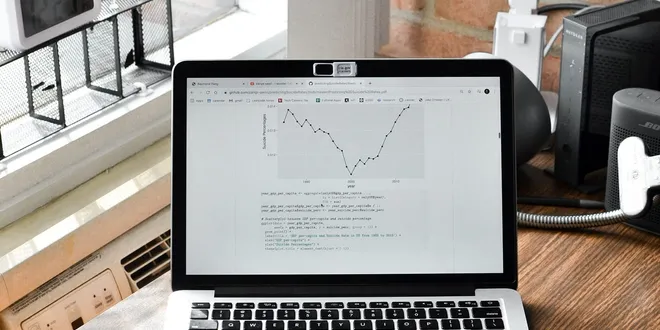
Visualizations with Matplotlib
Matplotlib is a very powerful data visualization library if you want to plot data with Python. The most used module is ‘pyplot’ which provides a collection of functions that lets you easily plot out…
Read more at Towards Data Science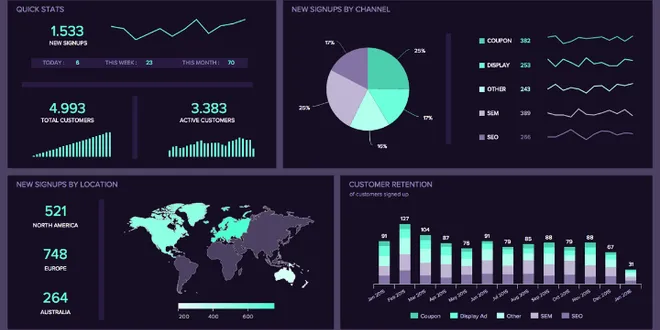
Data Visualization using Python Part-II
Here’s the Part-II to Data Visualization using Python Part-I. If you haven’t gone through it yet, do it right now! We shall now implement the same using Seaborn Library in Python! Matplotlib has…
Read more at Analytics Vidhya
Python Data Visualization Tools
Using data to find correlations is a valuable skill. But being able to convey these findings to other people who don’t have intimate familiarity with the data set is also very valuable. Knowing this…
Read more at Towards Data Science- «
- ‹
- …