AI-powered search & chat for Data / Computer Science Students

Prototyping for Effective Visualizations and Web Analytics Applications
Enhance your design thinking skills and productivity with Prototyping Photo by Kaleidico on Unsplash Overview The ability to use visual imagery to narrate a powerful story and to provide actionable i...
Read more at Towards Data Science
Web Design
Web design creates a compelling user experience for your Python web app. Learn more about web design on Full Stack Python.
Read more at Full Stack Python
Full Stack Basics for Data Scientists and Other Non-Web Developers, Part 2: jQuery, D3, AJAX and…
This is part 2 of a 2 part series on the basic full stack web development tools Data Scientists would need to build basic interactive visualizations on the web. The first part covered HTML and CSS…
Read more at Towards Data Science
You can create beautiful charts with PHP/SWF
I’m getting to the point where I need to display some of the information I’m analysing visually, as part of a web service. I’d looked at jpgraph, which seems to be the best known server-side graph cre...
Read more at Pete Warden's blog
How to optimize a webpage for clickthrough with simple Python code
Choosing the best layout, imagery and text to present to users on your webpage is hard. But, it doesn’t have to be. In fact *you* don’t need to choose — you can let data do it for you. In this post…
Read more at Analytics Vidhya
Build a web service that visualises data in a map
In this blog, I am going to explain how I visualise a couple of coordinates of locations and show them in a map with my browser. Before getting the hands dirty, some coordinates related to hospitals…
Read more at Analytics Vidhya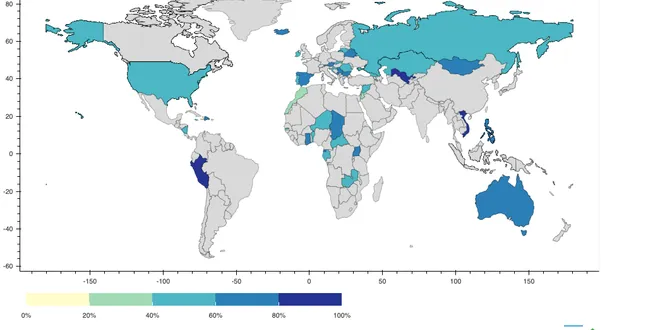
Hosting Your Interactive Visualizations
Visualizations make data accessible to everyone. They turn mind-numbing excel spreadsheets into fun and easy to understand graphs. They summarize, highlight, and good visualizations also allow the…
Read more at Towards Data Science
Interactive Data Visualization
Data Visualization helps unravel the hidden data patterns that naked eyes cannot see in a tabular format. It helps in understanding correlation and association between different data points…
Read more at Towards Data Science
Data visualization with Python and JavaScript
Learn how to create a data visualization project in Jupyter Notebook using Python and a JavaScript library for building pivot tables and pivot charts.
Read more at Python in Plain English
An easy technique for web scraping an interactive web chart
You browse a dynamic website with an interactive chart and it has all the data you need for your next data project. How should you go about web scraping? For this article, Gold prices in Brazilian…
Read more at Analytics Vidhya
Web Visualization with Plotly and Flask.
Why would you want to write HTML in Python? It baffles me. But that is what you need to do if you want to write a Dash app. While I understand that there is a certain amount of satisfaction in having…...
Read more at Towards Data Science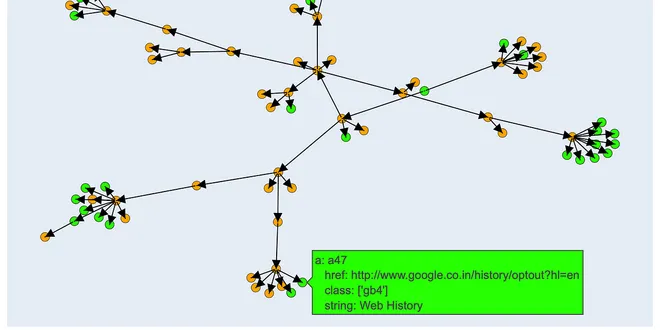
Visualise WebPages like never before with WebTree!
For everyone interested in Data Analytics, the biggest source of data that is freely available is the world wide web, a collection of millions of pages and an ever increasing gold mine that provides…
Read more at Analytics Vidhya
Web Analytics
Web analytics tools collect and visualize data from website visitors. Learn more on Full Stack Python.
Read more at Full Stack Python
A Beginner’s Guide to learn web scraping with python and data visualization
Imagine you have to pull a large amount of data from websites and you want to do it as quickly as possible. How would you do it without manually going to each website and getting the data? Well, “Web…...
Read more at Analytics Vidhya
Highly Interactive Data Visualization
Data Visualization impacts your storytelling because it helps the users get a clearer picture of what you are trying to say and the users can actually visualize the patterns, insights, etc. that you…
Read more at Towards Data Science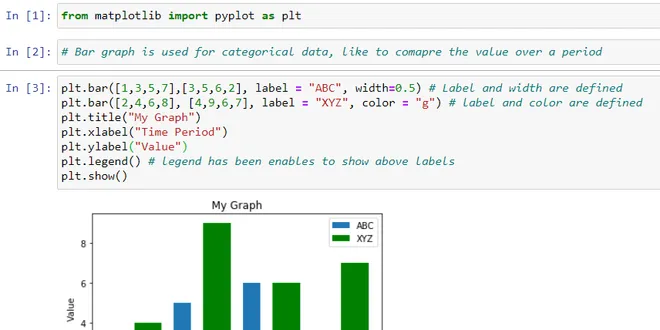
Visualization of Data
Data visualization is the graphical representation of information and data. By using visual elements like charts, graphs, and maps, data visualization tools provide an accessible way to see and…
Read more at Analytics Vidhya
Flapjax: Data Visualization on the Web with Plotly and Flask
The Flask framework Flask is a minimalist framework for developing Web applications. In a Flask app, the web page typically is built from a template and data supplied by the Python code — this data ca...
Read more at Towards Data Science
How I developed my Web App for Data Visualization with Python
I am not a web developer, but as a data analyst I think it is very useful to have a web application for data visualization where you can deploy your data and show the world your results. So, I…
Read more at Towards Data Science
The Beginner’s Guide to Web Development
Are you stuck wondering where to start? It is hard to find the right advice without suffering from information overload. In this article, I have laid out all the basics you will need to learn web…
Read more at Better Programming
Beautiful JavaScript Data Visualization Libraries
If you’re building a web app using JavaScript, it is inevitable that at some point you’ll need to display some data. Preferably in an easy-to-digest manner, which usually means generating some type…
Read more at Level Up Coding
Visualizing Data
Data visualization is one of the key skills expected these days while working with data. It helps in simplifying complex data into an understandable format and making decisions based on that…
Read more at Analytics Vidhya
NiceGUI: How to create stunning web interfaces in Python with minimal code
If you are looking for an easy way to create a web-based user interface (UI) with Python, you might want to check out nicegui. Nicegui is a Python package that lets you create buttons, dialogs, markdo...
Read more at Python in Plain English
Data Visualization For Everyone Pt 1
A guide to collecting, storing, and visualizing data.
Read more at Towards Data Science
Chart Visualization
Chart Visualization This section demonstrates visualization through charting. For information on visualization of tabular data please see the section on Table Visualization . We use the standard conve...
Read more at Pandas User Guide- «
- ‹
- …