chart
A chart is a visual representation of data designed to convey information clearly and efficiently. It transforms complex datasets into an easily digestible format, allowing viewers to identify trends, patterns, and relationships at a glance. Various types of charts, such as bar, line, and pie charts, serve different purposes and can enhance the understanding of the underlying data. Effective chart design involves careful consideration of elements like color, typography, and structure to ensure clarity and impact. By crafting a well-designed chart, one can significantly improve the communication of data insights to an audience.

Chart Visualization
Chart Visualization This section demonstrates visualization through charting. For information on visualization of tabular data please see the section on Table Visualization . We use the standard conve...
📚 Read more at Pandas User Guide🔎 Find similar documents

Area Charts: Standard, Stacked & Overlapping
An area chart is a form of line chart with the area between the horizontal axis and the line that connects data points filled with color. They are used to communicate an overall trend without being…
📚 Read more at Towards Data Science🔎 Find similar documents
The art of chart crafting
There’s a lot that can separate a good chart from a bad one. I often think of the final stages of creating a chart as crafting- the process of applying your specialised knowledge and refining the…
📚 Read more at Analytics Vidhya🔎 Find similar documents

Rendering Charts in Laravel Applications
People say that a picture is worth a thousand words. That couldn’t be truer for charts, which allow you to condense data into a meaningful message that one can easily digest. In this article, we will…...
📚 Read more at Better Programming🔎 Find similar documents

Storytelling with Charts
This is the fourth article in a series aimed at helping people to decide which type of chart to use according to the message they are trying to show to their particular audience. The previous three…
📚 Read more at Towards Data Science🔎 Find similar documents

Make your charts look glorious
Make Your Charts Look Glorious Simple formatting tricks to make matplotplib charts presentation-ready Photo by Luke Chesser on Unsplash Charts and graphs are far and away the best way to communicate ...
📚 Read more at Towards Data Science🔎 Find similar documents
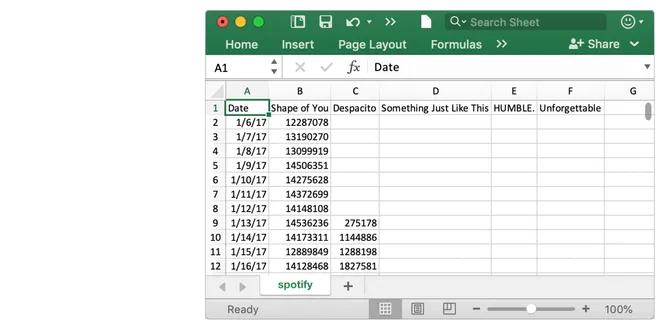
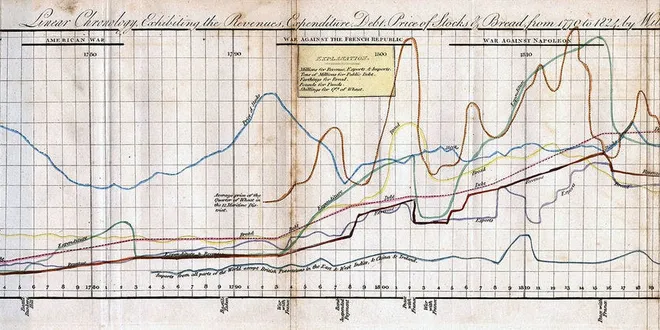
Line Charts
Now that you are familiar with the coding environment, it's time to learn how to make your own charts! In this tutorial, you'll learn just enough Python to create professional looking **line charts**....
📚 Read more at Kaggle Learn Courses🔎 Find similar documents

Line Charts
Now that you are familiar with the coding environment, it's time to learn how to make your own charts! In this tutorial, you'll learn just enough Python to create professional looking **line charts**....
📚 Read more at Kaggle Learn Courses🔎 Find similar documents
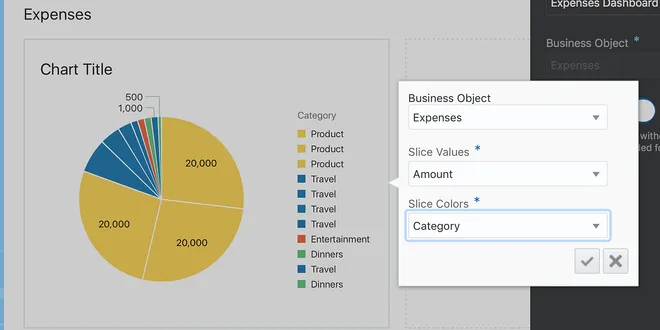
Aggregating Data in Charts with Visual Builder — Oracle Cloud
Charts are a great way to help users visualize data. Occassionally, however, there can be too much information or certain types of information that just end up making a chart too busy for the end user...
📚 Read more at Oracle Developers🔎 Find similar documents

A step-by-step chart makeover
Making a bad chart As part of the 30 Day Chart Challenge in April 2025, I made a (deliberately) bad chart, which didn’t follow any data visualisation best practices: There are many things wrong with t...
📚 Read more at R-bloggers🔎 Find similar documents
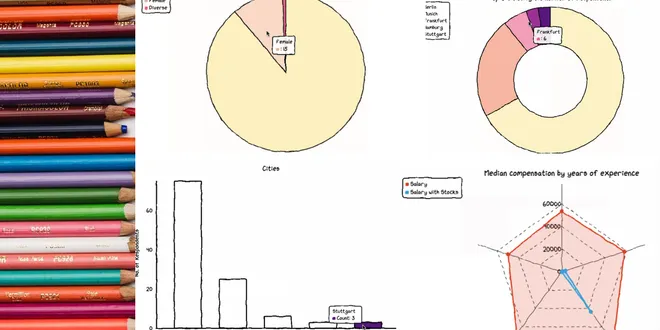
Increase the cuteness quotient of your charts
Hand-drawn charts look fancy, so much so that there exists a javascript library for creating them. Chart.xkcd is a visualization library that renders beautiful “hand-drawn” style charts that are also…...
📚 Read more at Towards Data Science🔎 Find similar documents
Making Beautiful Charts With ChartJS
Charts are everywhere. Infographics as ads, Medium statistics, YouTube stats, your workout statistics, and even your K/D ratio can be seen in charts. And if you’re developing an application with a…
📚 Read more at Better Programming🔎 Find similar documents