Tableau
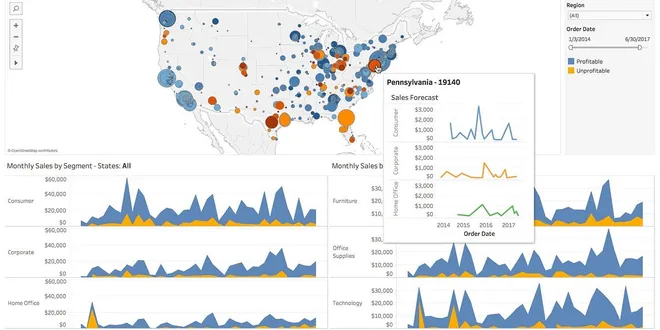
Tableau is a powerful Business Intelligence tool designed for data visualization and analysis. It enables users to create interactive and shareable dashboards that present data trends and insights through graphs and charts. With its user-friendly drag-and-drop interface, Tableau allows individuals, regardless of technical expertise, to connect to various data sources, including spreadsheets and databases, and transform raw data into meaningful visual representations. This capability not only enhances data comprehension but also supports informed decision-making in business environments. As a versatile tool, Tableau is widely used in the data science ecosystem for storytelling and effective communication of data insights.

Quick Notes on Tableau
Tableau is a Business Intelligence tool used to analyze data visually. Using Tableau, users can create shareable and interactive dashboards that show trends and variations in the form of graphs and…
📚 Read more at Analytics Vidhya🔎 Find similar documents

Tableau Behind The Scenes
Tableau is an incredible tool that empowers everyone to see and understand their data. And this can be done in seconds, with its distinguishing drag and drop feature, which allows to quickly discover…...
📚 Read more at Towards Data Science🔎 Find similar documents

World Happiness Dashboard in Tableau
Tableau is a powerful and efficient tool to create data visualizations. It allows for creating highly informative plots without writing any code. Besides, multiple visualizations can easily be…
📚 Read more at Towards Data Science🔎 Find similar documents

Hybrid Visualizations In Tableau
Tableau is an incredibly powerful tool for data scientists and data analysts to make sense of the data to produce a visualization, or “viz” for short. As a brief review — in Tableau, we work with…
📚 Read more at Towards Data Science🔎 Find similar documents

A Tableau Calculus for the Analysis of Experiments
Experimental analysis often involves analyzing groups containing varying numbers of elements; for example, a different number of units for each treatment assignment within each stratum. We therefore e...
📚 Read more at Towards Data Science🔎 Find similar documents

Tableau — The good and the bad
Hair-splitting Quirks and Nuances of Tableau Common issues and resolutions for effective reporting in Tableau Image by Angga Afin87 on Vecteezy Overview It’s a known fact that Tableau is a great visu...
📚 Read more at Towards Data Science🔎 Find similar documents

The Ultimate Cheat Sheet on Tableau Charts
Tableau Desktop is an awesome data analysis and data visualization tool. It allows you to see your data immediately (with a few drag and drops). The “Show Me” feature is extremely helpful especially…
📚 Read more at Towards Data Science🔎 Find similar documents

Tableau 101: Embark on Your Data Journey from Scratch
Why Tableau? Tableau provides a user-friendly, drag-and-drop interface that makes it quick and easy to create visualizations. Its ability to connect with various data sources — from Excel files to SQL...
📚 Read more at Python in Plain English🔎 Find similar documents

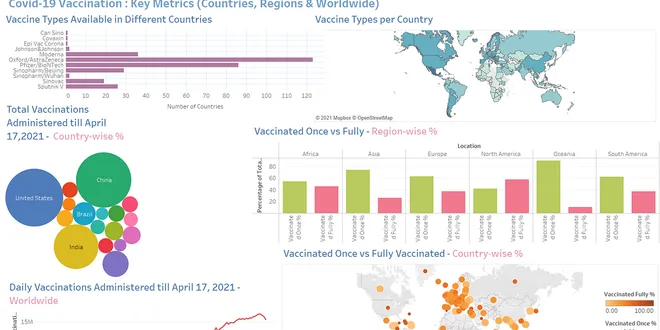
Building a Covid-19 Vaccination Dashboard in Tableau
Tableau is a powerful Data Visualization software, and much of its popularity is due to its interactive visualizations & user-friendly interface. With the Covid-19 Pandemic raging throughout the…
📚 Read more at Analytics Vidhya🔎 Find similar documents

Creating Powerful Animated Visualizations in Tableau
Tableau is a great tool for data analysis and visualization. It has some powerful tools to make the visualizations appealing and interactive. One such awesome feature is animated data visualization…
📚 Read more at Towards Data Science🔎 Find similar documents

Selective Formatting of Numbers in Tableau
Tableau Software is a surprisingly versatile tool. Not only does it provide a wide spectrum of data visualisation options but it is also a powerful reporting aid. While Tableau enables the user to…
📚 Read more at Towards Data Science🔎 Find similar documents

Tableau Masterclass: Mastering Data Analysis and Visualization
1. Getting Started with Tableau 1.1 Installing Tableau Tableau provides both a desktop application (Tableau Desktop) and a web-based version (Tableau Online). If you’re a beginner, start by downloadin...
📚 Read more at Python in Plain English🔎 Find similar documents

