Charts

Storytelling with Charts
This is the second part (of a fourth article) whose objective is to indicate which are the best data visualization techniques when the purpose of the message to be delivered to the audience is to show...
📚 Read more at Towards Data Science🔎 Find similar documents
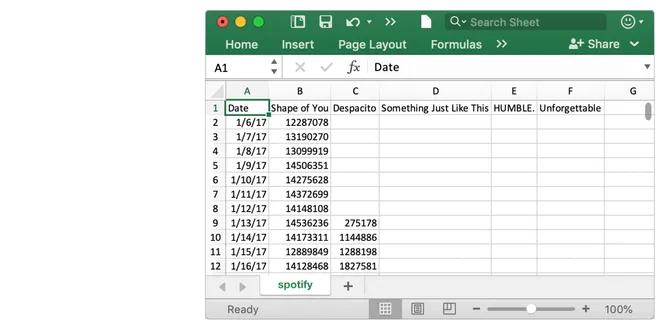
Line Charts
Now that you are familiar with the coding environment, it's time to learn how to make your own charts! In this tutorial, you'll learn just enough Python to create professional looking **line charts**....
📚 Read more at Kaggle Learn Courses🔎 Find similar documents
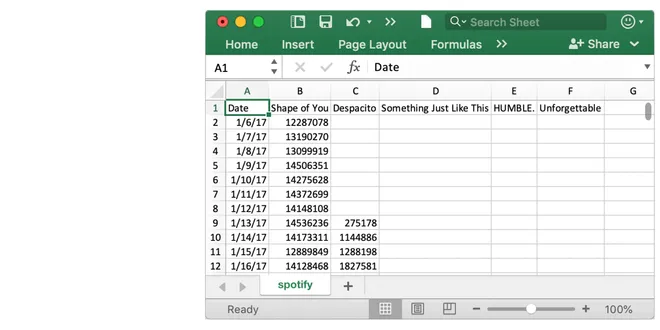
Line Charts
Now that you are familiar with the coding environment, it's time to learn how to make your own charts! In this tutorial, you'll learn just enough Python to create professional looking **line charts**....
📚 Read more at Kaggle Learn Courses🔎 Find similar documents

Line Charts
Now that you are familiar with the coding environment, it's time to learn how to make your own charts! In this tutorial, you'll learn just enough Python to create professional looking **line charts**....
📚 Read more at Kaggle Learn Courses🔎 Find similar documents
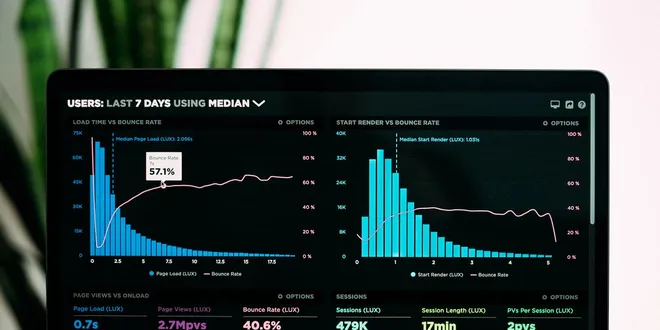
Making Beautiful Charts With ChartJS
Charts are everywhere. Infographics as ads, Medium statistics, YouTube stats, your workout statistics, and even your K/D ratio can be seen in charts. And if you’re developing an application with a…
📚 Read more at Better Programming🔎 Find similar documents

Area Charts: Standard, Stacked & Overlapping
An area chart is a form of line chart with the area between the horizontal axis and the line that connects data points filled with color. They are used to communicate an overall trend without being…
📚 Read more at Towards Data Science🔎 Find similar documents

Chart Visualization
Chart Visualization This section demonstrates visualization through charting. For information on visualization of tabular data please see the section on Table Visualization . We use the standard conve...
📚 Read more at Pandas User Guide🔎 Find similar documents

Chart Wars: Pie Chart vs. Sorted Radial Bar Chart
Bar charts may be the King of Charts, but let’s face it, they’re boring. Some popular alternatives, like pie charts, aren’t much better. Here’s a pie chart showing where Germany got its electricity in...
📚 Read more at Towards Data Science🔎 Find similar documents
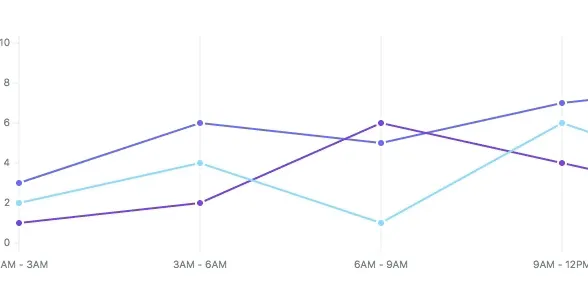
Modern and Simple Charts With Frappe Charts
Frappe Charts offers GitHub-inspired, modern, intuitive, and responsive charts with zero dependencies. I’ve been watching this project grow over the last few months and I think it is a great project…
📚 Read more at Better Programming🔎 Find similar documents
Understing the Intuition behind Charts 🎨
DataBites 7
📚 Read more at DataBites🔎 Find similar documents
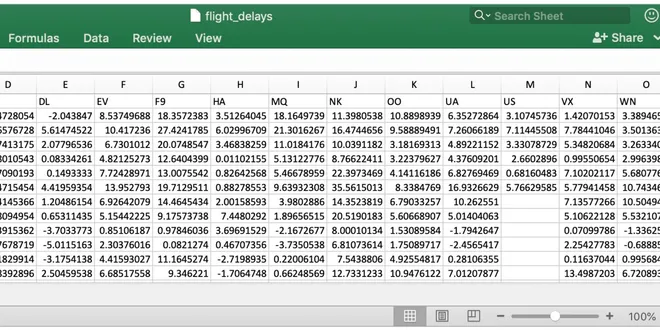
Bar Charts and Heatmaps
Now that you can create your own line charts, it's time to learn about more chart types! By the way, if this is your first experience with writing code in Python, you should be _very proud_ of all tha...
📚 Read more at Kaggle Learn Courses🔎 Find similar documents
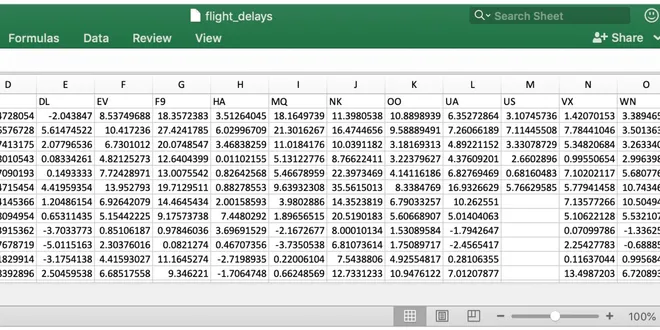
Bar Charts and Heatmaps
Now that you can create your own line charts, it's time to learn about more chart types! By the way, if this is your first experience with writing code in Python, you should be _very proud_ of all tha...
📚 Read more at Kaggle Learn Courses🔎 Find similar documents

