Dash
Dash is an open-source web framework designed for building interactive data visualizations and analytical applications using Python. It simplifies the process of creating web-based dashboards by leveraging components from Flask and Plotly, allowing users to generate complex graphs and visualizations without extensive web development knowledge. Dash applications are structured around a layout that defines the user interface and interactivity, making it accessible for both beginners and experienced developers. With its ability to handle real-time data and user inputs, Dash is widely used in data science and analytics to present insights effectively in a browser environment.

Charting with Plotly Dash
Dash is a python framework created by Plotly, a technical computing company located in Montreal, Canada. It is an open-source, free library, MIT licensed, by means of which you can create web-based…
📚 Read more at Towards Data Science🔎 Find similar documents

Build an Interactive, Modern Dashboard With Dash
Have you ever wanted to display a set of information graphically? Or in an easy to understand manner in any form of application? Dash, a productive Python framework, has made is much easier for you…
📚 Read more at Better Programming🔎 Find similar documents

How to Create an Interactive Dash Web Application
You’ve done the data science, now you need to present the results to the world! Dash is a python framework for building web applications. Written on top of Flask, Plotly.js and React.js, Dash is…
📚 Read more at Towards Data Science🔎 Find similar documents

Dash is Deeper than Dashboards
The missing link that makes Python a fullstack language Having no real-time front end experience apart from AJAX, Dash easily enabled me to develop this application Prologue: to set the stage, refere...
📚 Read more at Better Programming🔎 Find similar documents

Dash for Beginners: Create Interactive Python Dashboards
Dash is a python framework created by plotly for creating interactive web applications. Dash is written on the top of Flask, Plotly.js and React.js. With Dash, you don’t have to learn HTML, CSS and…
📚 Read more at Towards Data Science🔎 Find similar documents

Technical Encounter: Low Code With Dash
In the first part of the low-code technical encounter, we went through the differences in package dependencies, syntax, and application execution when we created a web data application with Dash, Stre...
📚 Read more at Better Programming🔎 Find similar documents

Live - Earthquake Tracking System Using Dash and Plotly.
A real-time earthquake tracking system using USGS data sources and showing the occurrences in a Dash app.
📚 Read more at Analytics Vidhya🔎 Find similar documents

A Dive into Dash
Around my office job, there are have been several discussions about the inclusion of dashboards. Typically, we used them to represent data to our business users, but with the new system, it was…
📚 Read more at Towards Data Science🔎 Find similar documents
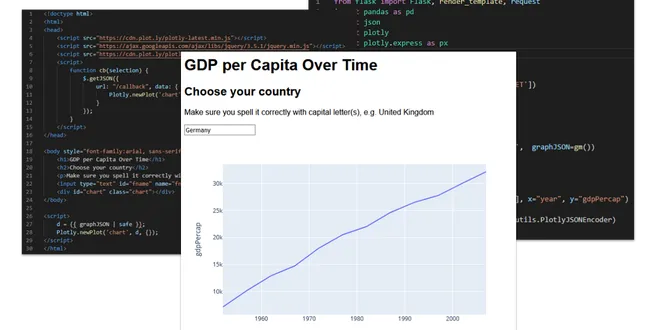
An Interactive Web Dashboard with Plotly and Flask
It may seem as if I have something against Dash. Honestly, I haven’t; it’s a fine product, comes with a lot of support from Plotly and does what it is intended to do, well. But, as I attempted to…
📚 Read more at Towards Data Science🔎 Find similar documents

Develop and Deploy Interactive Dashboards Using Python Dash
Plotly has come up with a new framework called Dash which allows users to create interactive dashboards with visualizations capabilities powered by plotly express. Dash core components are used as…
📚 Read more at Towards Data Science🔎 Find similar documents

Building Dashboards in Dash
Dashboards are a quick and effective way to utilize your data. With Plotly and Dash, building dashboards in Python has never been more straightforward.
📚 Read more at Towards Data Science🔎 Find similar documents

Plotly Dash: From Development to Deployment
Plotly Dash is an amazing framework to build interactive dashboards purely using Python. As a dashboard is akin to a website, definitely a bit of HTML & CSS is also involved, but be rest assured it…
📚 Read more at Towards Data Science🔎 Find similar documents