Kernel density estimation
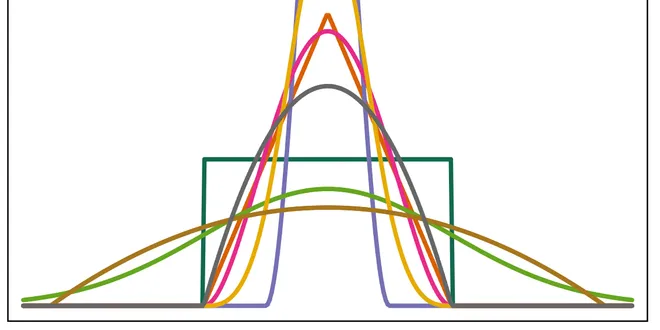
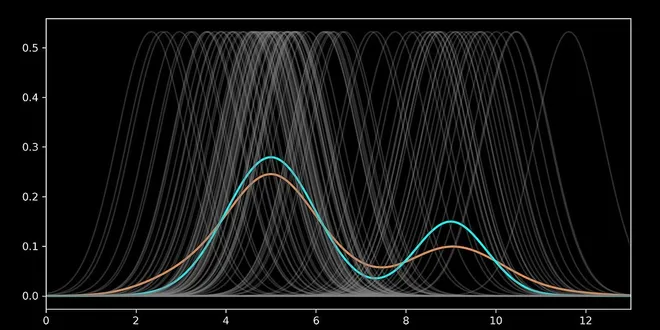
Kernel density estimation (KDE) is a non-parametric statistical technique used to estimate the probability density function of a random variable. By placing a kernel, such as a Gaussian function, at each data point, KDE creates a smooth curve that represents the underlying distribution of the dataset. The choice of kernel and the bandwidth, which controls the width of the kernel, significantly influence the smoothness and detail of the estimated density. This method is particularly useful for visualizing data distributions and uncovering patterns that may not be apparent through traditional histogram methods.
Kernel Density Estimation
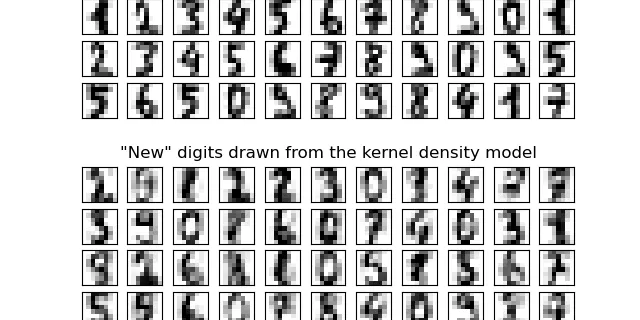
Kernel Density Estimation This example shows how kernel density estimation (KDE), a powerful non-parametric density estimation technique, can be used to learn a generative model for a dataset. With th...
📚 Read more at Scikit-learn Examples🔎 Find similar documents
ML04: Kernel Density Estimation
Kernel density estimation is a non-parametric model also know as KDE, it’s a technique that lets you create a smooth curve given a set of data. KDE basically centers a kernel function at each data…
📚 Read more at Analytics Vidhya🔎 Find similar documents
In-Depth: Kernel Density Estimation
In the previous section we covered Gaussian mixture models (GMM), which are a kind of hybrid between a clustering estimator and a density estimator. Recall that a density estimator is an algorithm whi...
📚 Read more at Python Data Science Handbook🔎 Find similar documents

The Math Behind Kernel Density Estimation
Exploring the foundations, concepts, and math of kernel density estimation The Kernel Density Estimator is a fundamental non-parametric method that is a versatile tool for uncovering the hidden distr...
📚 Read more at Towards Data Science🔎 Find similar documents

Bounded Kernel Density Estimation
Learn how Kernel Density Estimation works and how you can adjust it to better handle bounded data, like age, height, or price Photo by Maxim Berg on Unsplash Histograms are widely used and easily gra...
📚 Read more at Towards Data Science🔎 Find similar documents
Simple 1D Kernel Density Estimation
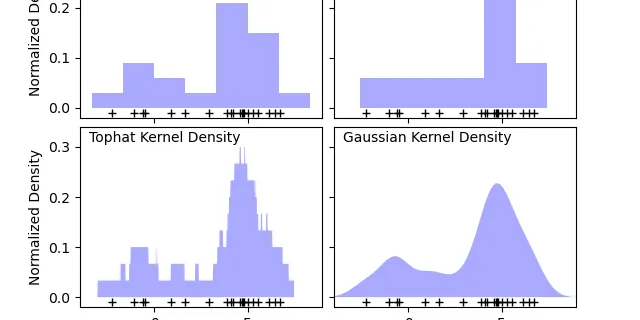
Simple 1D Kernel Density Estimation This example uses the KernelDensity class to demonstrate the principles of Kernel Density Estimation in one dimension. The first plot shows one of the problems with...
📚 Read more at Scikit-learn Examples🔎 Find similar documents

Kernel Density Estimation — Kernel Construction and Bandwidth Optimization using Maximum…
fundamentals about kernel function and its use to estimate kernel density explained in detail with an example
📚 Read more at Analytics Vidhya🔎 Find similar documents
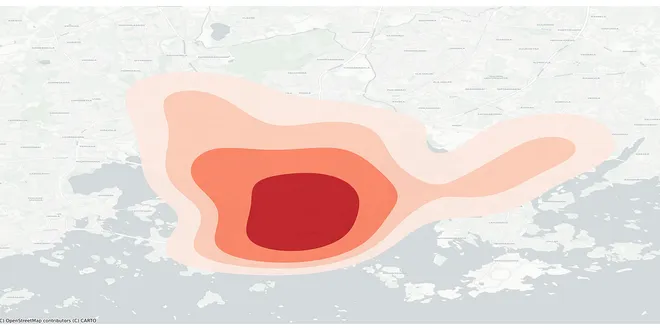
From Kernel Density Estimation to Spatial Analysis In Python
Kernel Density Estimation (KDE) is a useful analysis and visualisation tool that is often the end product of a visualisation or analysis workflow. Kernel Density Estimations are nice visualisations…
📚 Read more at Towards Data Science🔎 Find similar documents

Kernel Density Estimation (KDE): Unraveling the Intriguing Patterns with 5 Numerical Experiments
Understanding KDE and its Importance in Data Analysis Kernel Density Estimation (KDE) is a statistical technique used to estimate the probability density function (PDF) of a random variable. It provi...
📚 Read more at Level Up Coding🔎 Find similar documents
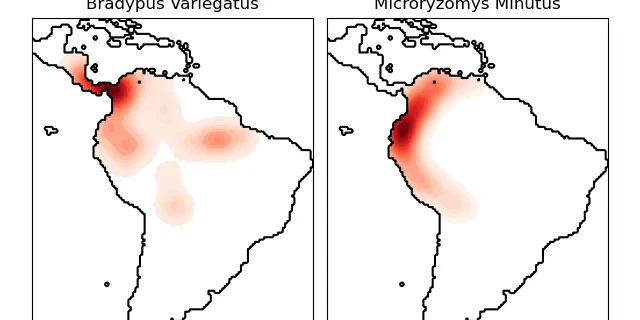
Kernel Density Estimate of Species Distributions
Kernel Density Estimate of Species Distributions This shows an example of a neighbors-based query (in particular a kernel density estimate) on geospatial data, using a Ball Tree built upon the Haversi...
📚 Read more at Scikit-learn Examples🔎 Find similar documents

Kernel Density Estimation explained step by step
Kernel Density Estimator explained step by step Intuitive derivation of the KDE formula Photo by Marcus Urbenz on Unsplash Introduction To get a sense of the data distribution, we draw probability de...
📚 Read more at Towards Data Science🔎 Find similar documents
Understanding Histograms and Kernel Density Estimation
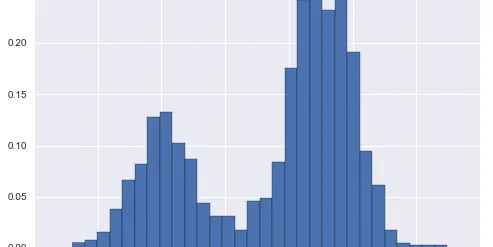
A histogram is a graph that visualizes the frequency of numerical data. It is commonly used in data science and statistics to have a raw estimate of the distribution of a dataset. Kernel density estim...
📚 Read more at Towards Data Science🔎 Find similar documents