Matplotlib
Matplotlib
Matplotlib is a data visualization plotting library that builds visuals in Python for output in Jupyter Notebooks and web apps.
📚 Read more at Full Stack Python🔎 Find similar documents

Introduction to Matplotlib
Matplotlib is a popular data visualization library for Python. It is used to create various types of charts, graphs, and plots to represent data in a visually appealing way. Matplotlib provides a…
📚 Read more at Level Up Coding🔎 Find similar documents

Unlimited Flexibility of Matplotlib
Matplotlib is a widely-used Python data visualization library that provides a numerous selection of 2D and 3D plots that are very useful for data analysis and machine learning tasks. The syntax for…
📚 Read more at Towards Data Science🔎 Find similar documents

Matplotlib Cheat Sheet
Matplotlib is a plotting library for the Python programming language. The most used module of Matplotib is Pyplot which provides an interface like Matlab but instead, it uses Python and it is open…
📚 Read more at Towards Data Science🔎 Find similar documents

Matplotlib
Matplotlib In this section, we will introduce Matplotlib, the most long-lived Python package for plotting data and images. It is designed to work nicely with NumPy arrays, and natively uses two and ...
📚 Read more at Python Like You Mean It🔎 Find similar documents

Library of the Week #3: Matplotlib
Why Matplotlib? Matplotlib is used to create data visualizations in python. It is a very good choice if you need to create charts with a high degree of customization and that look good for scientific ...
📚 Read more at Python in Plain English🔎 Find similar documents

Matplotlib — A Layered Data Visualization Library
Matplotlib is a comprehensive library for creating data visualizations in Python. Its architecture contains 3 layers, artist, scripting and backend.
📚 Read more at Analytics Vidhya🔎 Find similar documents
Visualization with Matplotlib
We'll now take an in-depth look at the Matplotlib package for visualization in Python. Matplotlib is a multi-platform data visualization library built on NumPy arrays, and designed to work with the br...
📚 Read more at Python Data Science Handbook🔎 Find similar documents

Matplotlib Ultimate Cheat Sheet (2021)
Matplotlib is a comprehensive library for creating static, animated, and interactive visualizations in Python. At first, using the library can seem daunting. However, with consistent practice, you…
📚 Read more at Level Up Coding🔎 Find similar documents
Data Visualization with Matplotlib
Matplotlib is a comprehensive library for creating static, animated, and interactive visualizations in Python. It is said that “Matplotlib makes easy things easy and hard things possible”. It is a…
📚 Read more at Analytics Vidhya🔎 Find similar documents
Matplotlib: Beyond Basic Plots - 10 Surprising Capabilities
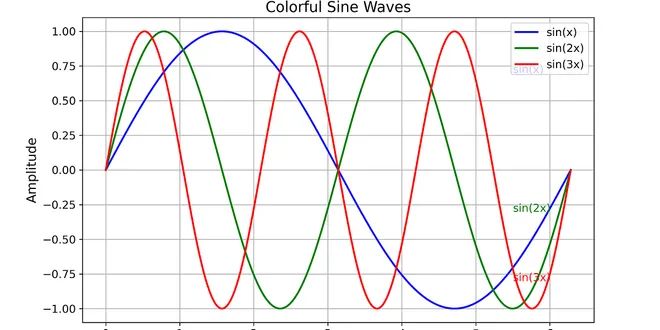
Matplotlib is a powerful and versatile plotting library in Python, widely used by data scientists, engineers, and researchers for visualizing data. While it offers a wide range of functions for…
📚 Read more at Python in Plain English🔎 Find similar documents
Matplotlib, Seaborn, Plotly and Plotnine Comparison
Matplotlib is a data visualization library in Python that is often used to create static, two-dimensional plots. Here is an example of how you might use Matplotlib to create a simple line plot…
📚 Read more at Python in Plain English🔎 Find similar documents

