Plotly&source=&contentType=
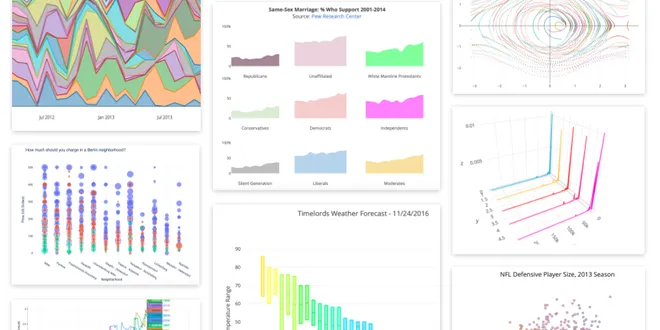
Plotly is an open-source Python library designed for creating interactive visualizations, making it a popular choice among data scientists and analysts. It supports a wide range of chart types, including scatter plots, bar charts, line graphs, and heatmaps, allowing users to present data in visually appealing ways. One of its key features is the ability to generate interactive plots that respond to user interactions, enhancing the data exploration experience. With modules like Plotly Express and Plotly Graph Objects, users can easily create complex visualizations with minimal code, making data visualization accessible to both beginners and experienced programmers alike.

Python Plotly Library: Exploring Data Visualization with Plotly
What is Plotly? Plotly is an open-source Python library that specializes in creating interactive visualizations for web applications, notebooks, and dashboards. It supports a variety of chart types, i...
📚 Read more at Python in Plain English🔎 Find similar documents

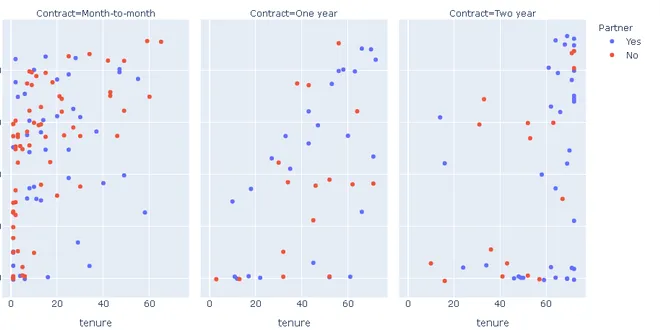
Interactive Distribution Plots with Plotly
Plotly Python (plotly.py) is an open-source plotting library built on plotly javascript (plotly.js). Plotly express is a high-level interface of plotly.py that allows us to create many interactive…
📚 Read more at Towards Data Science🔎 Find similar documents

Python:Plotly
Plotly is a Python library for creating interactive visualizations and charts, offering a variety of visualization options like line graphs , bar charts , heatmaps , and scatter plots . Installation T...
📚 Read more at Codecademy🔎 Find similar documents

Interactive Ternary Plots with Plotly
Plotly Python (plotly.py) is an open-source plotting library built on plotly javascript (plotly.js). One of the things I like about plotly.py is that it offers a high-level API (plotly express) and a…...
📚 Read more at Towards Data Science🔎 Find similar documents
How To Create a Plotly Visualization And Embed It On Websites
Plotly is an open-source, simple-to-use charting library for python. Plotly.express was built as a wrapper for Plotly.py to make creating interactive visualizations as easy as writing one line of…
📚 Read more at Towards Data Science🔎 Find similar documents

Interactive Visualizations with Plotly
Plotly Python (plotly.py) is an open-source plotting library built on plotly javascript (plotly.js). It allows to create interactive visualizations that can be displayed in Jupyter notebooks. It can…
📚 Read more at Towards Data Science🔎 Find similar documents
How to Create Interactive Visualizations with Plotly Express
Plotly Python (plotly.py) is an open-source plotting library built on plotly javascript (plotly.js). Plotly express is a high-level interface of plotly.py that allows us to create many interactive…
📚 Read more at Towards Data Science🔎 Find similar documents

A Lesser-known Feature of Creating Plots with Plotly
Plotly is pretty diverse when it comes to creating different types of charts. While many folks prefer it for interactivity, you can also use it to create animated plots. Here's an animated visualizati...
📚 Read more at Daily Dose of Data Science🔎 Find similar documents
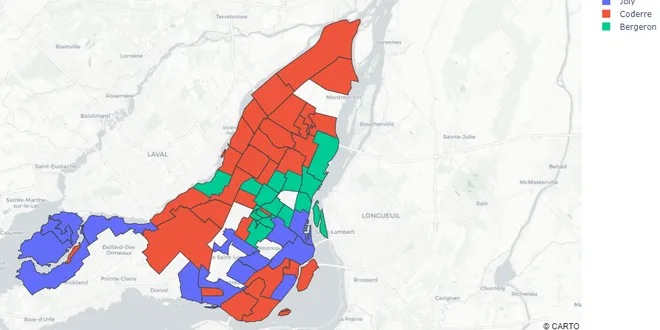
Creating Geographical Plots Using Plotly
Plotly is an open-source library that creates high-level interactive graphs it can be used to plot various types of graphs and charts easily. Creating a geographical plot has never been so easy…
📚 Read more at Towards Data Science🔎 Find similar documents

Get Started with Plotly @ Jupyter Lab
What is Plotly? It’s an interactive Python graphing library. You can make many beautiful and engaging charts using Plotly, such as line plots, scatter plots, box plots, histograms, and heatmaps.
📚 Read more at Analytics Vidhya🔎 Find similar documents
Library of the week #8: Plotly
Why Plotly? When it comes to data visualization in Python, you want a library that offers both versatility and user-friendly interactive features. That’s where Plotly shines. Whether you’re just getti...
📚 Read more at Python in Plain English🔎 Find similar documents

Stacked Bar Charts with Plotly Express
Plotly, a computing company headquartered in Montreal, Canada, developed plotly.py, an interactive, open-source visualization tool for Python. In 2019, the company released Plotly 4.0 which includes…
📚 Read more at Towards Data Science🔎 Find similar documents