Plotly&source=&contentType=
Plotly is an open-source library designed for creating interactive visualizations in Python. It leverages JavaScript in the backend to produce visually appealing and highly interactive graphs and charts. Users can easily create a variety of plots, including scatter plots, geographical maps, and more, using simple syntax. The library supports two main methods for figure creation: using figures as dictionaries or graph objects. Additionally, Plotly can be integrated into Jupyter notebooks, making it a popular choice for data analysis and visualization. Practicing with different plot types is essential for mastering this powerful tool.
Python Plotly Library: Exploring Data Visualization with Plotly
What is Plotly? Plotly is an open-source Python library that specializes in creating interactive visualizations for web applications, notebooks, and dashboards. It supports a variety of chart types, i...
📚 Read more at Python in Plain English🔎 Find similar documents

Interactive Ternary Plots with Plotly
Plotly Python (plotly.py) is an open-source plotting library built on plotly javascript (plotly.js). One of the things I like about plotly.py is that it offers a high-level API (plotly express) and a…...
📚 Read more at Towards Data Science🔎 Find similar documents

Interactive Visualizations with Plotly
Plotly Python (plotly.py) is an open-source plotting library built on plotly javascript (plotly.js). It allows to create interactive visualizations that can be displayed in Jupyter notebooks. It can…
📚 Read more at Towards Data Science🔎 Find similar documents
How To Create a Plotly Visualization And Embed It On Websites
Plotly is an open-source, simple-to-use charting library for python. Plotly.express was built as a wrapper for Plotly.py to make creating interactive visualizations as easy as writing one line of…
📚 Read more at Towards Data Science🔎 Find similar documents
Library of the week #8: Plotly
Why Plotly? When it comes to data visualization in Python, you want a library that offers both versatility and user-friendly interactive features. That’s where Plotly shines. Whether you’re just getti...
📚 Read more at Python in Plain English🔎 Find similar documents
How to Create Interactive Visualizations with Plotly Express
Plotly Python (plotly.py) is an open-source plotting library built on plotly javascript (plotly.js). Plotly express is a high-level interface of plotly.py that allows us to create many interactive…
📚 Read more at Towards Data Science🔎 Find similar documents
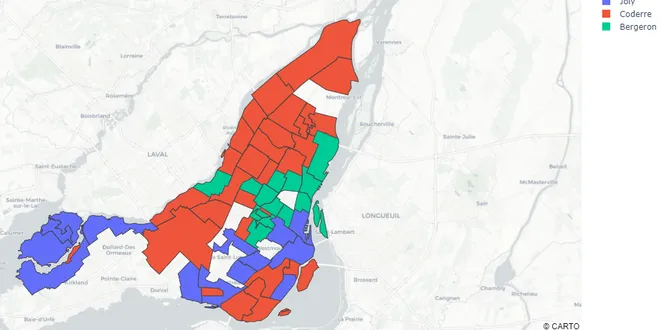
Creating Geographical Plots Using Plotly
Plotly is an open-source library that creates high-level interactive graphs it can be used to plot various types of graphs and charts easily. Creating a geographical plot has never been so easy…
📚 Read more at Towards Data Science🔎 Find similar documents

Get Started with Plotly @ Jupyter Lab
What is Plotly? It’s an interactive Python graphing library. You can make many beautiful and engaging charts using Plotly, such as line plots, scatter plots, box plots, histograms, and heatmaps.
📚 Read more at Analytics Vidhya🔎 Find similar documents

Analyzing U.S. exports with Plotly
In my previous article, I’ve been providing an introduction to some useful graphical tools available in Plotly, an opensource library which can be used both in Python and R. Here, I’m going to play a…...
📚 Read more at Analytics Vidhya🔎 Find similar documents

Getting Started with Plot.ly
Matplotlib is alright, Seaborn is great, but Plot.ly? That’s on an entirely new level. Plot.ly offers more than your average graph by providing options for full interactivity and many editing tools…
📚 Read more at Towards Data Science🔎 Find similar documents

Stacked Bar Charts with Plotly Express
Plotly, a computing company headquartered in Montreal, Canada, developed plotly.py, an interactive, open-source visualization tool for Python. In 2019, the company released Plotly 4.0 which includes…
📚 Read more at Towards Data Science🔎 Find similar documents

Analyze and Visualize Articles Published at GeeksforGeeks Using Plotly
Creating relevant charts using the Plotly visualizations library Photo by Towfiqu barbhuiya on Unsplash With the increased use of data analysis in the business the programmers are also responsible to...
📚 Read more at Python in Plain English🔎 Find similar documents