Power BI
Power BI is a powerful business intelligence tool developed by Microsoft, designed to transform raw data into insightful visualizations and reports. It enables users to connect to various data sources, including cloud databases and local files, facilitating data analysis and decision-making. With its user-friendly interface and intuitive drag-and-drop features, Power BI allows users to create interactive dashboards that present data in a visually appealing manner. This tool is widely used across industries to enhance analytics capabilities, streamline reporting processes, and support informed business decisions, making it an essential asset for organizations aiming to leverage their data effectively.
POWER BI vs TABLEAU
Power BI is a business analytics service by Microsoft. It aims to provide interactive visualizations and business intelligence capabilities with an interface simple enough for end users to create…
📚 Read more at Analytics Vidhya🔎 Find similar documents

Microsoft Power Bi Released in Jupyter Notebook
Power BI is a cloud-based business analytics service by Microsoft enabling anyone to visualize and analyze data with greater speed, efficiency, and high understanding. So Microsoft has introduced a…
📚 Read more at Analytics Vidhya🔎 Find similar documents
Lets play with Data in PowerBI
As we all know that Power BI is a business analytics service by Microsoft and it helps to provide interactive visualizations and business intelligence capabilities with an interface simple enough for…...
📚 Read more at Analytics Vidhya🔎 Find similar documents
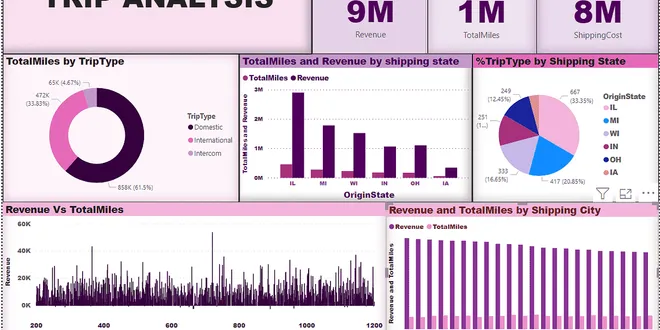
Power BI: Beyond Dashboards
Business intelligence is no longer a luxury; it’s a necessity for organizations aiming to make informed decisions. Among the myriad tools available, Power BI stands out as a powerhouse for data analys...
📚 Read more at Python in Plain English🔎 Find similar documents

Power BI — An analogy with cup cakes!
There is Power BI, Power Query, DAX, M and the visualization store. There is also the Power BI cloud, reports and dashboards and dataflows. This is a tool that can make your life so much easier when…
📚 Read more at Towards Data Science🔎 Find similar documents

Truly Customizing Power BI with React, Angular, or any web framework
With the growth of the amount of data available in organizations, presenting it in a clear and direct way is increasingly important. In this context, Power BI — Microsoft’s business analysis tool —…
📚 Read more at Towards Data Science🔎 Find similar documents
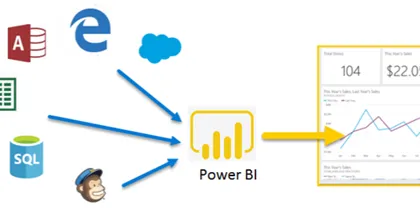
Power BI Data Sources
In the previous blog, we had learnt what exactly Power BI is and how we can use it at an organisational level to make better business and managerial decisions related to data. If you haven’t read…
📚 Read more at Analytics Vidhya🔎 Find similar documents
A complete beginners guide on Power BI
Hey there ! I am excited to share my first ever blog on power BI and It is not far for you to write your own blog either. Power BI is a powerful data visualization tool that is widely used in the…
📚 Read more at Analytics Vidhya🔎 Find similar documents

Setting-Up Power BI for Power and Intelligent Results
And understanding why Photo by Olav Ahrens Røtne on Unsplash Introduction Microsoft Power BI is a popular and powerful business intelligence platform that is used to drive analytics at multiple organ...
📚 Read more at Towards Data Science🔎 Find similar documents
10 Key Filter Functions in DAX for Power BI
Power BI, as a leading business intelligence tool, empowers users to derive insights from data through interactive visualizations and… Continue reading on Javarevisited
📚 Read more at Javarevisited🔎 Find similar documents

Microsoft Power BI — From Data Modelling to Stunning Reports
What can this visualization tool do for you? Continue reading on Towards Data Science
📚 Read more at Towards Data Science🔎 Find similar documents

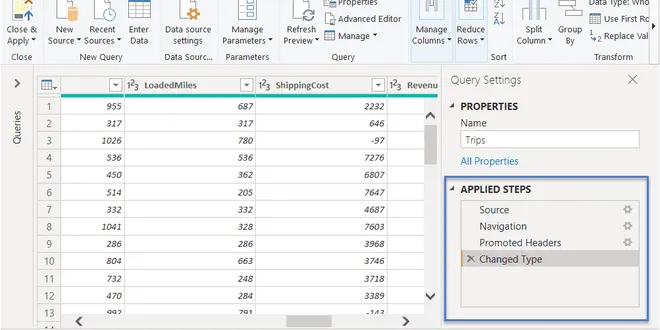
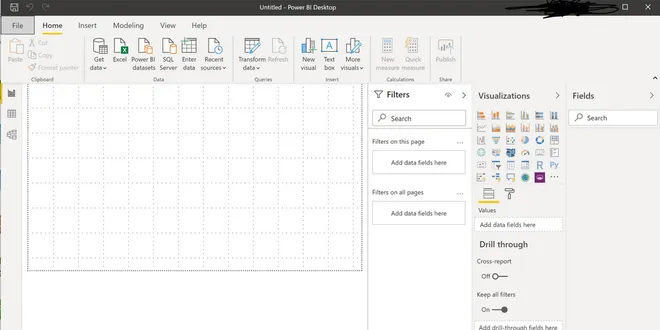
Explore Power BI Desktop
I updated my current Power BI Desktop version via the Windows Apps Store recently, and now it is a good time to share the new user interface (UI) of the Power BI after the installation. In the year…
📚 Read more at Analytics Vidhya🔎 Find similar documents