R2
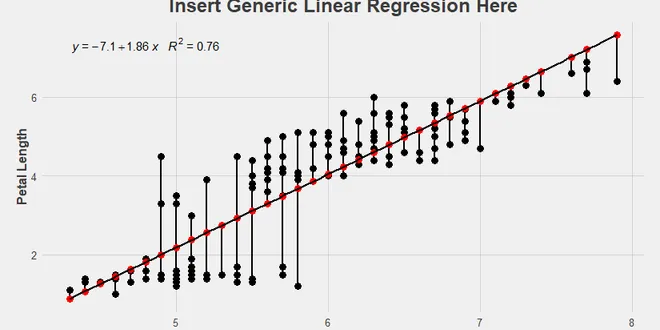
R², or R-squared, is a statistical metric commonly used to assess the goodness of fit for regression models. It quantifies the proportion of variance in the dependent variable that can be explained by the independent variables in the model. While R² is widely utilized in both statistical analysis and machine learning, its interpretation can be misleading. It is essential to understand that a high R² value does not necessarily indicate a good predictive model, as it may not account for overfitting or the significance of individual predictors. Thus, R² should be used alongside other metrics for a comprehensive evaluation.
Moving Away From R²
R² is a well known model metric that every data analyst has in her toolbelt, but despite its prevalence, there is a mismatch between how data analysts tend to talk about and use this metric versus…
📚 Read more at Towards Data Science🔎 Find similar documents

Interpreting R²: a Narrative Guide for the Perplexed
An accessible walkthrough of fundamental properties of this popular, yet often misunderstood metric from a predictive modeling perspective Photo by Josh Rakower on Unsplash R² (R-squared), also known...
📚 Read more at Towards Data Science🔎 Find similar documents

What is R² score in Regression?
R-squared is a statistical measure that represents the goodness of fit. The R-squared score for a perfect fit of a regression model is 1. i.e, the model is fitted well as the r-squared value is close ...
📚 Read more at Python in Plain English🔎 Find similar documents
The Complete Guide to R-squared, Adjusted R-squared and Pseudo-R-squared
The technical definition of R² is that it is the proportion of variance in the response variable 'y' that your regression model is able to "explain" via the introduction of regression variables.
📚 Read more at Towards Data Science🔎 Find similar documents

r² or R² — When to Use What
The Pearson correlation coefficient (r) is used to identify patterns in things whereas the coefficient of determination (R²) is used to identify the strength of a model.
📚 Read more at Towards Data Science🔎 Find similar documents
Data Science: Explaining R² in Statistics
R-squared is a metric of correlation. Correlation is measured by “r” and it tells us how strongly two variables can be related. A correlation closer to +1 means a strong relationship in the positive…
📚 Read more at Towards Data Science🔎 Find similar documents
R-Squared(R²)
Tutorial for calculating R² using Python with data provided from MacroTrends. Full working code provided to the reader. This article serves as a step by step tutorial for the R² method with full work...
📚 Read more at Python in Plain English🔎 Find similar documents

Explore R2 and Adjusted-R2 metrics intuitively
In this article, you will learn intuitively how R2 and Adjusted-R2 metrics work. Photo by Siora Photography on Unsplash R2 is widely used as an evaluation metric for regression machine learning tasks...
📚 Read more at Towards AI🔎 Find similar documents

Explaining negative R-squared
When I first started out doing machine learning, I learnt that: * R² is the coefficient of determination, a measure of how well is the data explained by the fitted model, * R² is the square of the coe...
📚 Read more at Towards Data Science🔎 Find similar documents

Comprehensive Guide on R-squared
R-squared ( $R^2$ ) is a popular performance metric for linear regression to assess the model's goodness-of-fit. There are two equivalent interpretations of $R^2$ : $R^2$ captures how much of the tota...
📚 Read more at Skytowner Guides on Machine Learning🔎 Find similar documents

Explained vs. Predictive Power: R², Adjusted R², and Beyond
1 Introduction You trust R². Should you? You proudly present a model with R² = 0.95. Everyone applauds. But what if your model fails miserably on the next new data? When building a statistical model, ...
📚 Read more at R-bloggers🔎 Find similar documents

Negative R2: Where Did You Go Wrong?
A statistical example Continue reading on Towards Data Science
📚 Read more at Towards Data Science🔎 Find similar documents