Seaborn&source=&contentType=

Seaborn Ultimate Cheat Sheet (2021)
Seaborn is a library for creating beautiful visualizations in Python. It is built on top of matplotlib and provides a high-level API for drawing pretty statistical graphs. At first, using the library…...
📚 Read more at Level Up Coding🔎 Find similar documents
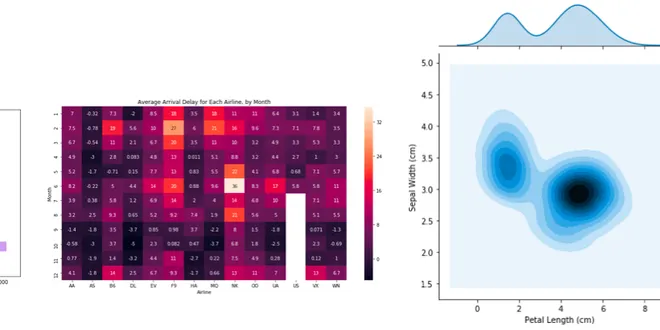
Hello, Seaborn
Welcome to Data Visualization! In this hands-on course, you'll learn how to take your data visualizations to the next level with [seaborn](https://seaborn.pydata.org/index.html), a powerful but easy-...
📚 Read more at Kaggle Learn Courses🔎 Find similar documents
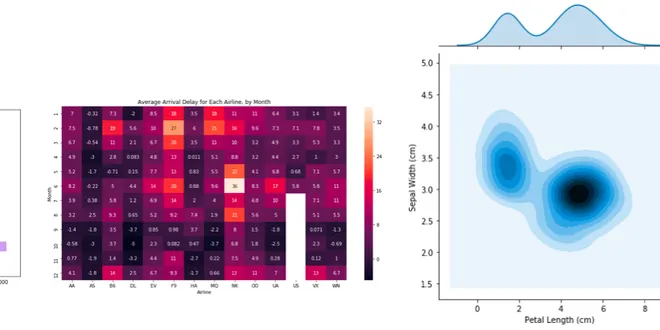
Hello, Seaborn
Welcome to Data Visualization! In this hands-on course, you'll learn how to take your data visualizations to the next level with [seaborn](https://seaborn.pydata.org/index.html), a powerful but easy-...
📚 Read more at Kaggle Learn Courses🔎 Find similar documents
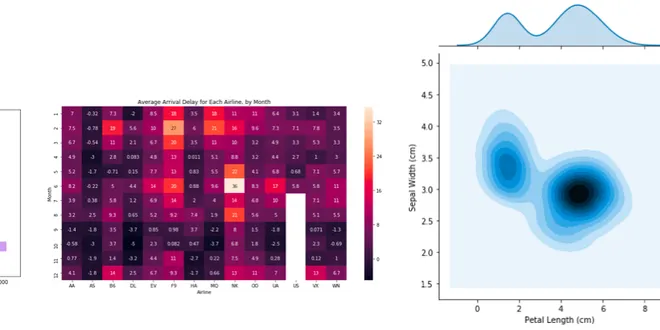
Hello, Seaborn
Welcome to Data Visualization! In this hands-on course, you'll learn how to take your data visualizations to the next level with [seaborn](https://seaborn.pydata.org/index.html), a powerful but easy-...
📚 Read more at Kaggle Learn Courses🔎 Find similar documents

Basic Seaborn Guide
Seaborn is a visualisation library that sits on top of matplotlib, making it nicer to look at and adding some extra capabilities too. Data visualisation allows data scientists to communicate their…
📚 Read more at Towards Data Science🔎 Find similar documents

Categorical Plots in Seaborn
Seaborn is a data visualization library of Python similar to other visualization libraries like Matplotlib and Plotly. It is based on Matplotlib library. Seaborn is a powerful Python library that…
📚 Read more at Analytics Vidhya🔎 Find similar documents

Plotting with Seaborn: Part 1
Seaborn is a library for making statistical graphics in Python. It builds on top of matplotlib and integrates closely with pandas data structures. Seaborn helps you explore and understand your data…
📚 Read more at Analytics Vidhya🔎 Find similar documents
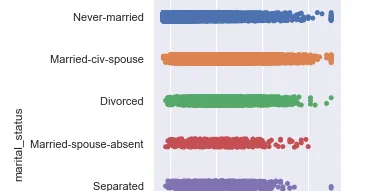
Data Visualization using Seaborn
Seaborn is a Python data visualization library based on matplotlib. It provides a high-level interface for drawing attractive and informative statistical graphics. Note: This article assumes you are…
📚 Read more at Towards Data Science🔎 Find similar documents

How to use Seaborn for Data Visualization
Seaborn is an open-source Python library built on top of matplotlib. It is used for data visualization and exploratory data analysis. Seaborn works easily with dataframes and the Pandas library. The…
📚 Read more at Towards Data Science🔎 Find similar documents

Beginner’s Guide to Visualizations with Seaborn
Getting started with Data Visualization with Seaborn Photo by NEW DATA SERVICES on Unsplash Data visualization is a great way to make sense of data and share it with others. It helps you see patterns...
📚 Read more at Python in Plain English🔎 Find similar documents

Seaborn: Python
Seaborn is a data visualization library built on top of matplotlib and closely integrated with pandas data structures in Python. Visualization is the central part of Seaborn which helps in…
📚 Read more at Towards Data Science🔎 Find similar documents
8 Soundest Seaborn Visualizations
Hands-on statistical plots with Seaborn using the penguin dataset. Blog Thumbnail made via Canva To do a project in data science, you first need to understand data. Data visualization is one of the b...
📚 Read more at Level Up Coding🔎 Find similar documents

