T SNE
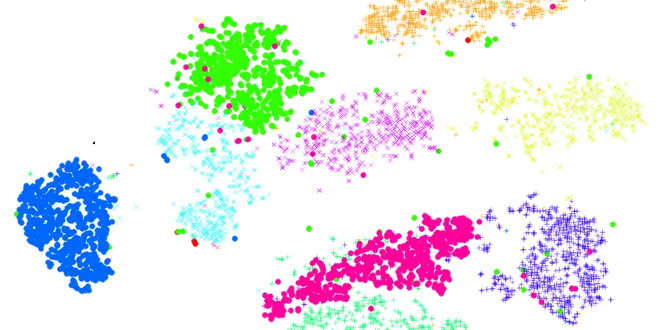
t-SNE, or t-Distributed Stochastic Neighbor Embedding, is a powerful algorithm used for visualizing high-dimensional data. It excels in reducing dimensions while preserving the local structure of the data, making it easier to identify patterns and relationships. By transforming complex datasets into two or three dimensions, t-SNE allows users to visualize clusters and similarities among data points effectively. This technique is particularly beneficial in fields like natural language processing and image analysis, where understanding the underlying structure of data is crucial. Its ability to reveal hidden patterns makes t-SNE a valuable tool for data exploration and analysis.

What is t-SNE?
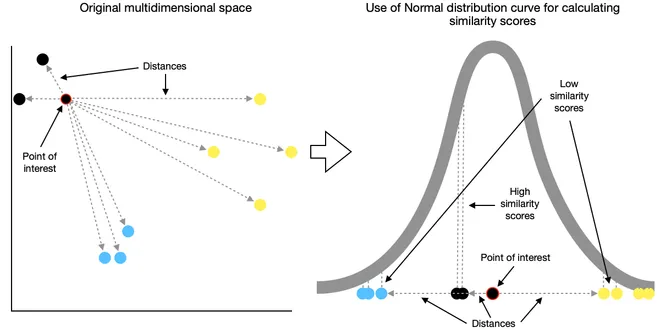
t-SNE ( t-Distributed Stochastic Neighbor Embedding) is a technique that visualizes high dimensional data by giving each point a location in a two or three-dimensional map. The technique is the…
📚 Read more at Analytics Vidhya🔎 Find similar documents

t-SNE Python Example
t-Distributed Stochastic Neighbor Embedding (t-SNE) is a dimensionality reduction technique used to represent high-dimensional dataset in a low-dimensional space of two or three dimensions so that we…...
📚 Read more at Towards Data Science🔎 Find similar documents

T-SNE (Geometric Intuition)
T-SNE stands for geometric T distributed Stochastic Neighbourhood Embedding. This is one of the state of art for dimensionality reduction especially for visualization of data. T-SNE is one of the…
📚 Read more at Analytics Vidhya🔎 Find similar documents

Understanding t-SNE by Implementation
How does t-SNE Work and How It Can be Implemented Image by author. In this blog post we will look into inner workings of the t-SNE algorithm, to clearly understand how it works, what it could be used...
📚 Read more at Towards Data Science🔎 Find similar documents

Visualizing topic groups using t-SNE
t-SNE is a powerful approach commonly used to visualize high dimensional data. We used this technique to create visualizations of the core questions being asked in Zendesk Support instances.
📚 Read more at Towards Data Science🔎 Find similar documents

Reducing data dimensions in a non-linear subspace: t-SNE
T-Distributed Stochastic Neighbor Embedding (t-SNE) is a prize-winning technique for non-linear dimensionality reduction that is particularly well suited for the visualization of high-dimensional…
📚 Read more at Analytics Vidhya🔎 Find similar documents

Why You Are Using t-SNE Wrong
t-SNE has become a very popular technique for visualizing high dimensional data. It’s extremely common to take the features from an inner layer of a deep learning model and plot them in 2-dimensions…
📚 Read more at Towards Data Science🔎 Find similar documents

How to Use t-SNE Effectively
Although extremely useful for visualizing high-dimensional data, t-SNE plots can sometimes be mysterious or misleading. By exploring how it behaves in simple cases, we can learn to use it more effecti...
📚 Read more at Distill🔎 Find similar documents

How To Avoid Getting Misled by t-SNE Projections?
t-SNE is among the most powerful dimensionality reduction techniques to visualize high-dimensional datasets. In my experience, most folks have at least heard of the t-SNE algorithm. In fact, do you kn...
📚 Read more at Daily Dose of Data Science🔎 Find similar documents
Using t-SNE for Movie Transcript Analysis
A Practical Guide Using Python In this article, we’ll explore a down-to-earth example of how to use t-SNE in Python to understand movie transcripts better. There are plenty of technical resources out...
📚 Read more at Python in Plain English🔎 Find similar documents

Visualize multi-dimension datasets in a 2D graph using t-SNE (Airbnb bookings dataset as example)
First of all, what is t-SNE and when and why are we using it? It is an unsupervised and non-linear dimension reduction algorithm, people usually use it during exploratory data analysis, an early…
📚 Read more at Analytics Vidhya🔎 Find similar documents
t-SNE Machine Learning Algorithm — A Great Tool for Dimensionality Reduction in Python
How to use t-Distributed Stochastic Neighbor Embedding (t-SNE) to visualize high-dimensionality data?
📚 Read more at Towards Data Science🔎 Find similar documents