cumulative distribution
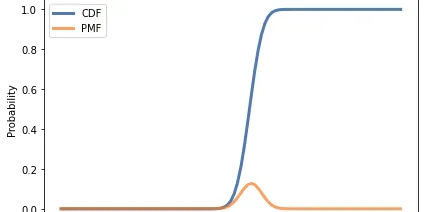
Cumulative distribution refers to a statistical function that describes the probability of a random variable taking on a value less than or equal to a specific point. It provides a comprehensive view of the distribution of data, allowing for easy visualization and comparison of probabilities. The cumulative distribution function (CDF) is particularly useful in various fields, including statistics and data science, as it summarizes the underlying distribution of a dataset. By plotting the CDF, analysts can identify trends, assess data spread, and detect outliers, making it an essential tool for understanding and interpreting data distributions effectively.

Chapter 4 Cumulative distribution functions
The code for this chapter is in cumulative.py . For information about downloading and working with this code, see Section 0.2 . 4.1 The limits of PMFs PMFs work well if the number of values is small. ...
📚 Read more at Think Stats🔎 Find similar documents
Demystifying Data: A Comprehensive Guide to Calculating and Plotting Cumulative Distribution Functions (CDFs) in R
Introduction In the realm of statistics, a cumulative distribution function (CDF) serves as a crucial tool for understanding the behavior of data. It provides a comprehensive picture of how a variable...
📚 Read more at R-bloggers🔎 Find similar documents

What Is A Cumulative Distribution Function?
Back in May, I took a look at a distribution function that belongs to most statistical distributions called the Probability Density Function, or PDF. The PDF is a very important part of statistical…
📚 Read more at Towards Data Science🔎 Find similar documents

Distributions
Click here to run this notebook on Colab or click here to download it . In this chapter we’ll see three ways to describe a set of values: A probability mass function (PMF), which represents a set of ...
📚 Read more at Elements of Data Science🔎 Find similar documents
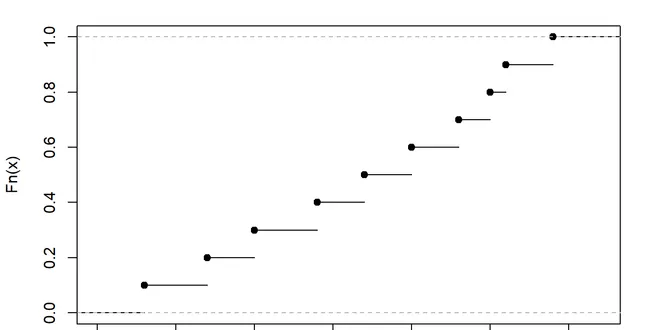
ECDF (Empirical Cumulative Distribution Function) Plot: Understanding and Implementation in Data…
ECDF (Empirical Cumulative Distribution Function) Plot: Understanding and Implementation in Data Science Data science and statistical analysis offer a variety of tools to explore and understand data ...
📚 Read more at Python in Plain English🔎 Find similar documents
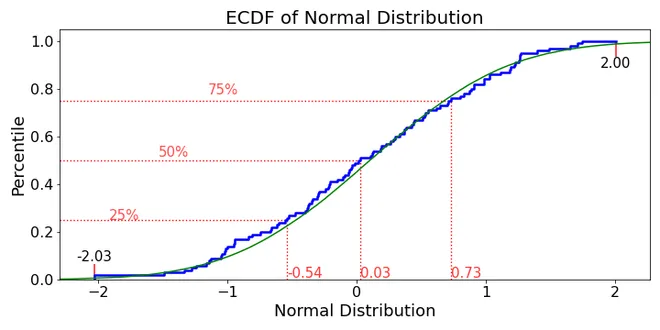
Empirical Cumulative Distribution Function: The Only Plotting Tool a Data Scientist Needs
After reading this article, you’ll never use a histogram again The modern data scientist swims in an ocean of plotting techniques. From matplotlib to ggplot2; from plotly to d3.js; from histograms, t...
📚 Read more at Towards Data Science🔎 Find similar documents

Distributions
Now that we have learned how to work with probability in both the discrete and the continuous setting, let’s get to know some of the common distributions encountered. Depending on the area of machine ...
📚 Read more at Dive intro Deep Learning Book🔎 Find similar documents

Probability Distributions for Beginners
One of the key issues in mathematical writing is a lack of symbolic legends and relevant explanations. ...There are two things we need to associate with each random variable: (1) a pointwise distribut...
📚 Read more at Towards Data Science🔎 Find similar documents
Minimum, Maximum, and Mixture
In the previous chapter we computed distributions of sums. In this chapter, we’ll compute distributions of minimums and maximums, and use them to solve both forward and inverse problems. Then we’ll l...
📚 Read more at Think Bayes🔎 Find similar documents

The Bernoulli and Binomial Distributions
The probability for a discrete random variable can be summarized with a discrete probability distribution. A discrete random variable is a random variable that can have one of a finite set of…
📚 Read more at Analytics Vidhya🔎 Find similar documents

Some Examples of Cumulative Mean with {TidyDensity}
Introduction Cumulative mean is a statistical measure that calculates the mean of a set of numbers up to a certain point in time or after a certain number of observations. It is also known as a runnin...
📚 Read more at R-bloggers🔎 Find similar documents

Unraveling the Complexity of Distributions in Statistics
Part 3: Navigating the Complex World of Distribution: A Complete Guide for the different distributions that you must know before going for the data analysis. Photo by Carlos Muza on Unsplash “Data ar...
📚 Read more at Towards AI🔎 Find similar documents