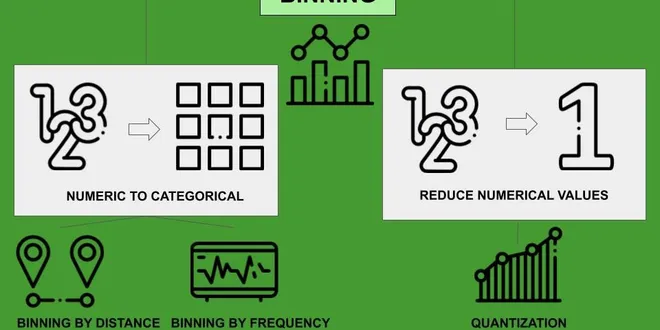
data binning
Data binning is a data preprocessing technique used to group continuous values into discrete intervals, known as bins. This method simplifies the data by reducing the number of unique values, which can help mitigate the effects of minor observation errors and enhance the performance of machine learning models. By replacing original values within a bin with a representative value, such as the bin’s central value, analysts can create a more manageable dataset. Binning is particularly useful in data analysis, as it aids in visualizing distributions and improving model accuracy by reducing noise in the data.
Data Preprocessing with Python Pandas — Part 5 Binning
Data binning (or bucketing) groups data in bins (or buckets), in the sense that it replaces values contained into a small interval with a single representative value for that interval. Sometimes…
📚 Read more at Towards Data Science🔎 Find similar documents

Spatial Binning with Google BigQuery
Data binning is a useful common practice in Data Science and Data Analysis in several ways: discretization of a continuous variable in Machine Learning or simply making a histogram for ease of…
📚 Read more at Towards Data Science🔎 Find similar documents

Data Binning with Pandas Cut or Qcut Method
Binning the data can be a very useful strategy while dealing with numeric data to understand certain trends. Sometimes, we may need an age range, not the exact age, a profit margin not profit, a…
📚 Read more at Towards Data Science🔎 Find similar documents
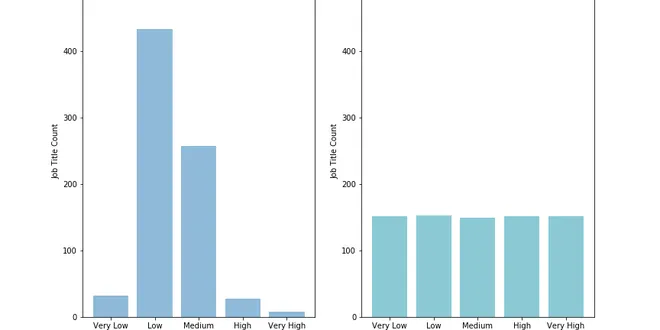
Binning Records on a Continuous Variable with Pandas Cut and QCut
Today, I’ll be using the “City of Seattle Wages: Comparison by Gender –Wage Progression Job Titles” data set to explore binning — aka grouping records — along a single numeric variable. Find the data…...
📚 Read more at Towards Data Science🔎 Find similar documents

Is Binning in Data Analysis a Good Idea?
Data analysis is a very important part of the data scientist’s job. Because I am not actually employed by a company as a data scientist, I must acquire my skills by taking courses or entering…
📚 Read more at Python in Plain English🔎 Find similar documents

All Pandas qcut() you should know for binning numerical data based on sample quantiles
Numerical data is common in data analysis. Often you have numerical data that is continuous, very large scales, or highly skewed. Sometimes, it can be easier to bin those data into discrete…
📚 Read more at Towards Data Science🔎 Find similar documents

A Beginner’s Guide to Converting Numerical Data to Categorical: Binning and Binarization
That’s exactly what converting numerical data into categorical data can do for you! In today’s post, we’ll dive into two game-changing techniques: Binning and Binarization , perfect for scenarios like...
📚 Read more at Towards AI🔎 Find similar documents
The Role of Data Blending and Data Munging in the Data Science Process
Data science is a multidisciplinary field that utilizes scientific methods, processes, algorithms, and systems to extract knowledge and insights from structured and unstructured data. The lifecycle of...
📚 Read more at Python in Plain English🔎 Find similar documents
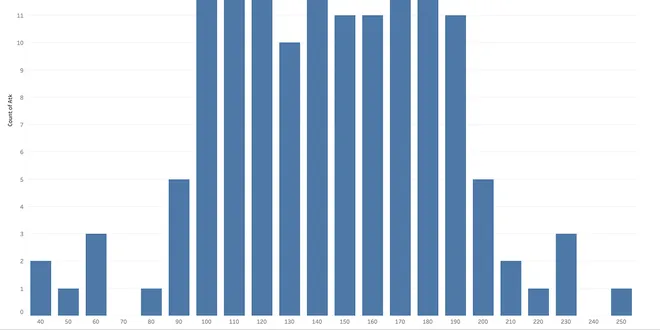
Data Scientists: STOP Randomly Binning Histograms
Histograms are a crucial part of Exploratory Data Analysis. But we often abuse them by randomly choosing a number of bins. Let’s use math.
📚 Read more at Analytics Vidhya🔎 Find similar documents

Databaiting
Databaiting: to entice someone to submit their data by eliciting an emotional response. Is it a useful description?
📚 Read more at Towards Data Science🔎 Find similar documents

Generating binary data by specifying the relative risk, with simulations
The most traditional approach for analyzing binary outcome data is logistic regression, where the estimated parameters are interpreted as log odds ratios or, if exponentiated, as odds ratios (ORs). No...
📚 Read more at R-bloggers🔎 Find similar documents

Data Reduction
More data doesn’t always mean better insights. In fact, excessive data storage can cripple your operations, inflate costs, and slow down decision-making. Introduction In today’s data-driven world, or...
📚 Read more at Towards AI🔎 Find similar documents