percentile quantile
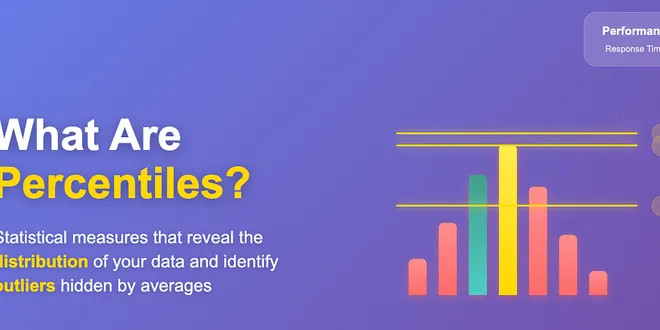
Percentile and quantile are statistical concepts used to describe the distribution of data. A percentile indicates the value below which a certain percentage of observations fall, while quantiles divide the data into equal parts. For instance, the first quartile (Q₁) represents the 25th percentile, meaning 25% of the data points are below this value. Understanding these measures is crucial for analyzing data distributions, identifying outliers, and making informed decisions based on statistical insights. They are widely used in various fields, including finance, education, and health, to interpret and communicate data effectively.

R Percentile
A percentile is a statistical measure that indicates the value below which a percentage of data falls. For example, the 70th percentile is the value below which 70% of the observations may be found. C...
📚 Read more at R-bloggers🔎 Find similar documents
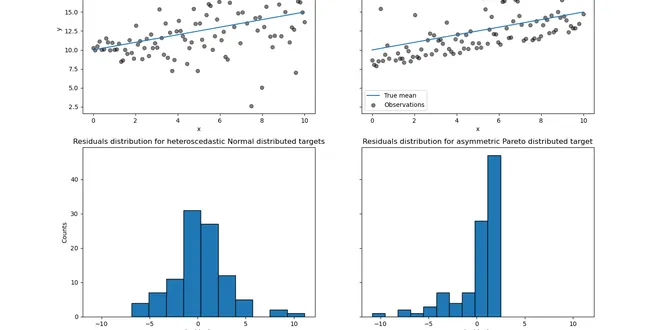
Quantile regression
Quantile regression This example illustrates how quantile regression can predict non-trivial conditional quantiles. The left figure shows the case when the error distribution is normal, but has non-co...
📚 Read more at Scikit-learn Examples🔎 Find similar documents

torch.quantile
Computes the q-th quantiles of each row of the input tensor along the dimension dim . To compute the quantile, we map q in [0, 1] to the range of indices [0, n] to find the location of the quantile in...
📚 Read more at PyTorch documentation🔎 Find similar documents
Understanding Percentiles in Performance Monitoring: A Deep Dive
If you using New relic the percentile numbers may look something like this Mathematical Definition If you have a dataset sorted in ascending order, the Pth percentile is the value below which P% of th...
📚 Read more at Javarevisited🔎 Find similar documents

What are quartiles?
We have a sequence with n=12 (numbers from 14 to 57) and let’s imagine these represent the number of tractors some 12 farms have in the northern region of Statistics Land. Quartiles analysis is part…
📚 Read more at Towards Data Science🔎 Find similar documents
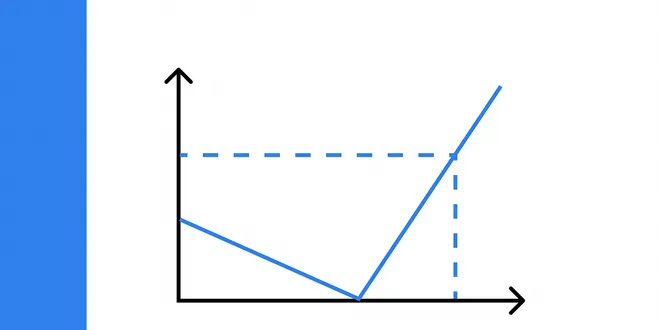
Quantile Loss & Quantile Regression
Learn how to adjust regression algorithms to predict any quantile of data Introduction Regression is a machine learning task where the goal is to predict a real value based on a set of feature vector...
📚 Read more at Towards Data Science🔎 Find similar documents
From Scratch to Deep Quantile Forecasting
An end-2-end empirical sharing of multi-step quantile forecasting with Tensorflow, NeuralForecast, and Zero-shot LLMs. Image by Author Content 1. Short Introduction 2. Data 3. Build a Toy Version of ...
📚 Read more at Towards Data Science🔎 Find similar documents
Mastering Quantile Normalization in R: A Step-by-Step Guide
Introduction Quantile normalization is a crucial technique in data preprocessing, especially in fields like genomics and bioinformatics. It ensures that the distributions of different samples are alig...
📚 Read more at R-bloggers🔎 Find similar documents

Quantile Regression with Random Forests
In my December 22 blog, I first introduced the classic parametric quantile regression (QR) concept. I then showed how one could use the qeML package to perform quantile regression nonparametrically, u...
📚 Read more at R-bloggers🔎 Find similar documents
An introduction to quantile regression
Ordinary least square regression is one of the most widely used statistical methods. However, it is a parametric model and relies on assumptions that are often not met. Quantile regression makes no…
📚 Read more at Towards Data Science🔎 Find similar documents

How to Calculate Percentiles in R
The post How to Calculate Percentiles in R appeared first on finnstats. How to Calculate Percentiles in R, Although percentages and percentiles are different concepts, they are comparable in many ways...
📚 Read more at R-bloggers🔎 Find similar documents

Probabilistic ML with Quantile Matching: an Example with Python
Quantile regression Quantile matching Python example: predict diabetes progression Conclusion When we train regressive models, we obtain point predictions. However, in practice we are often interested...
📚 Read more at Towards Data Science🔎 Find similar documents