Dash-python
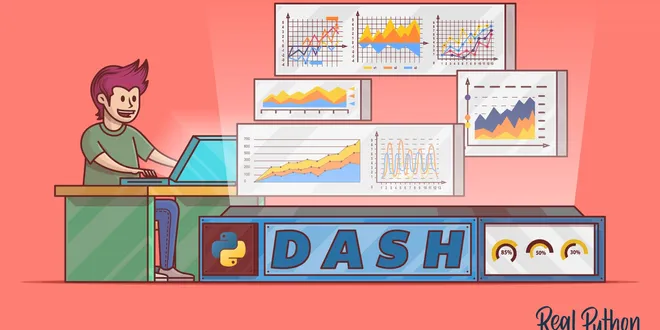
Dash is an open-source Python framework developed by Plotly, designed for creating interactive web applications and data visualization interfaces. It allows users to build analytical dashboards using only Python, eliminating the need for extensive knowledge of HTML, CSS, or JavaScript. Dash applications are built on top of Flask, Plotly.js, and React.js, making it a powerful tool for data scientists and analysts. With its user-friendly approach, Dash enables the creation of visually appealing and responsive dashboards that can be deployed easily, making it an ideal choice for showcasing data insights and analytics.

Dash for Beginners: Create Interactive Python Dashboards
Dash is a python framework created by plotly for creating interactive web applications. Dash is written on the top of Flask, Plotly.js and React.js. With Dash, you don’t have to learn HTML, CSS and…
📚 Read more at Towards Data Science🔎 Find similar documents
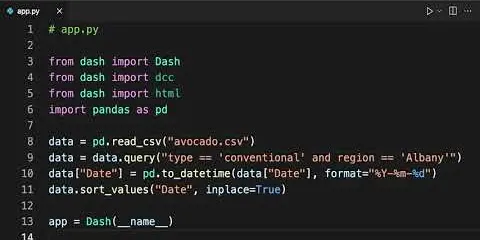
Develop Data Visualization Interfaces in Python With Dash
In this tutorial, you'll learn how to build a dashboard using Python and Dash. Dash is a framework for building data visualization interfaces. It helps data scientists build fully interactive web appl...
📚 Read more at Real Python🔎 Find similar documents

Create a dashboard using Python and Dash
Create a Dashboard Using Python and Dash Introduction In the realm of data science and analytics, the power of data is unleashed not just by extracting insights but also by effectively communicating ...
📚 Read more at Python in Plain English🔎 Find similar documents

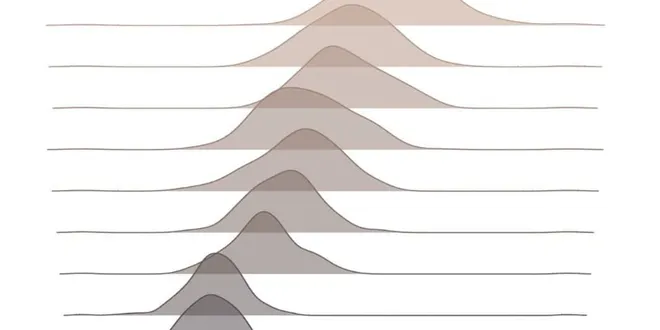
Charting with Plotly Dash
Dash is a python framework created by Plotly, a technical computing company located in Montreal, Canada. It is an open-source, free library, MIT licensed, by means of which you can create web-based…
📚 Read more at Towards Data Science🔎 Find similar documents
Starting Data Visualizations With Dash and Python
In the past, creating analytical web applications was a task for seasoned developers that required knowledge of multiple programming languages and frameworks. That’s no longer the case. Nowadays, you ...
📚 Read more at Real Python🔎 Find similar documents

Reporting Dashboard using Python Dash
In this post, i will be quickly taking you through use of Python Dash to present real time results obtained from ML Models. Python Dash is python framework based for building beautiful web based…
📚 Read more at Analytics Vidhya🔎 Find similar documents
Create Better Data Visualizations with Python and Dash
How to use Python and Dash library to create, style, and host an interactive data analysis web application.
📚 Read more at Python in Plain English🔎 Find similar documents

How to Create an Interactive Dash Web Application
You’ve done the data science, now you need to present the results to the world! Dash is a python framework for building web applications. Written on top of Flask, Plotly.js and React.js, Dash is…
📚 Read more at Towards Data Science🔎 Find similar documents
Advancing to Professional Dashboard with Python, using Dash
Ways to enhance initial skeleton code
📚 Read more at Towards Data Science🔎 Find similar documents

Building Dashboards in Dash
Dashboards are a quick and effective way to utilize your data. With Plotly and Dash, building dashboards in Python has never been more straightforward.
📚 Read more at Towards Data Science🔎 Find similar documents
C for Python Developers and Data Visualization With Dash | Real Python Podcast #46
Are you interested in building interactive dashboards with Python? How about a project that takes a flat data file all the way to a web-hosted interactive dashboard? This week on the show, David Amos ...
📚 Read more at Real Python🔎 Find similar documents
Develop and Deploy Interactive Dashboards Using Python Dash
Plotly has come up with a new framework called Dash which allows users to create interactive dashboards with visualizations capabilities powered by plotly express. Dash core components are used as…
📚 Read more at Towards Data Science🔎 Find similar documents