Matplotlib
Matplotlib is a widely-used data visualization library in Python, designed to create a variety of static, animated, and interactive plots. It allows developers to generate high-quality graphs, charts, and figures that effectively represent data in a visually appealing manner. With its extensive customization options, Matplotlib caters to both beginners and advanced users, making it a versatile tool for data analysis and presentation. The library integrates seamlessly with Jupyter Notebooks and other Python environments, enabling users to visualize data easily and efficiently. Whether for exploratory data analysis or publication-quality graphics, Matplotlib is an essential resource for data scientists and analysts.
Matplotlib
Matplotlib is a data visualization plotting library that builds visuals in Python for output in Jupyter Notebooks and web apps.
📚 Read more at Full Stack Python🔎 Find similar documents

Unlimited Flexibility of Matplotlib
Matplotlib is a widely-used Python data visualization library that provides a numerous selection of 2D and 3D plots that are very useful for data analysis and machine learning tasks. The syntax for…
📚 Read more at Towards Data Science🔎 Find similar documents
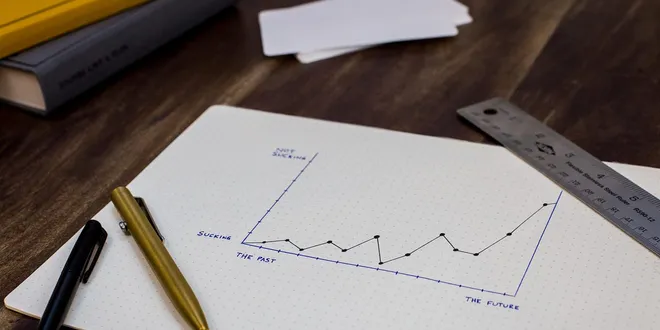
Introduction to Matplotlib
Matplotlib is a popular data visualization library for Python. It is used to create various types of charts, graphs, and plots to represent data in a visually appealing way. Matplotlib provides a…
📚 Read more at Level Up Coding🔎 Find similar documents

Matplotlib Cheat Sheet
Matplotlib is a plotting library for the Python programming language. The most used module of Matplotib is Pyplot which provides an interface like Matlab but instead, it uses Python and it is open…
📚 Read more at Towards Data Science🔎 Find similar documents
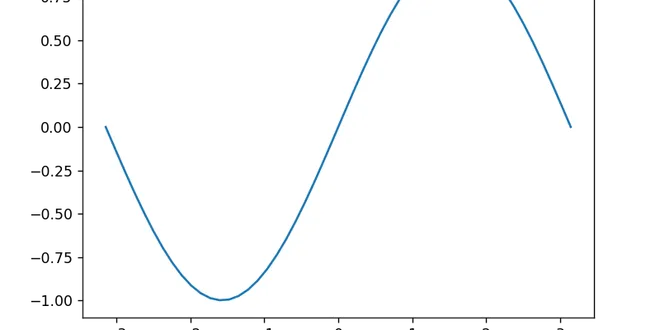
Matplotlib
Matplotlib In this section, we will introduce Matplotlib, the most long-lived Python package for plotting data and images. It is designed to work nicely with NumPy arrays, and natively uses two and ...
📚 Read more at Python Like You Mean It🔎 Find similar documents
Library of the Week #3: Matplotlib
Why Matplotlib? Matplotlib is used to create data visualizations in python. It is a very good choice if you need to create charts with a high degree of customization and that look good for scientific ...
📚 Read more at Python in Plain English🔎 Find similar documents

Matplotlib — A Layered Data Visualization Library
Matplotlib is a comprehensive library for creating data visualizations in Python. Its architecture contains 3 layers, artist, scripting and backend.
📚 Read more at Analytics Vidhya🔎 Find similar documents
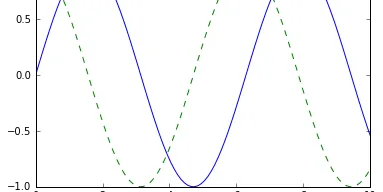
Visualization with Matplotlib
We'll now take an in-depth look at the Matplotlib package for visualization in Python. Matplotlib is a multi-platform data visualization library built on NumPy arrays, and designed to work with the br...
📚 Read more at Python Data Science Handbook🔎 Find similar documents
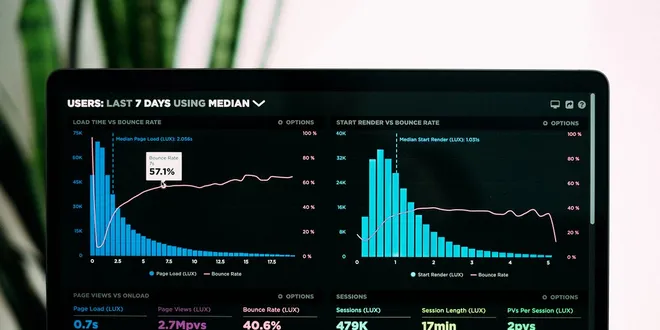
Matplotlib Ultimate Cheat Sheet (2021)
Matplotlib is a comprehensive library for creating static, animated, and interactive visualizations in Python. At first, using the library can seem daunting. However, with consistent practice, you…
📚 Read more at Level Up Coding🔎 Find similar documents
Data Visualization with Matplotlib
Matplotlib is a comprehensive library for creating static, animated, and interactive visualizations in Python. It is said that “Matplotlib makes easy things easy and hard things possible”. It is a…
📚 Read more at Analytics Vidhya🔎 Find similar documents
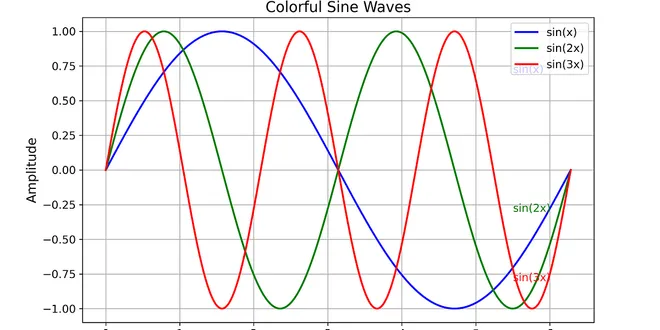
Matplotlib: Beyond Basic Plots - 10 Surprising Capabilities
Matplotlib is a powerful and versatile plotting library in Python, widely used by data scientists, engineers, and researchers for visualizing data. While it offers a wide range of functions for…
📚 Read more at Python in Plain English🔎 Find similar documents
Matplotlib, Seaborn, Plotly and Plotnine Comparison
Matplotlib is a data visualization library in Python that is often used to create static, two-dimensional plots. Here is an example of how you might use Matplotlib to create a simple line plot…
📚 Read more at Python in Plain English🔎 Find similar documents

