Seaborn

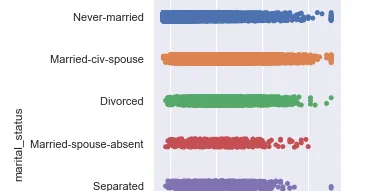
Categorical Plots in Seaborn
Seaborn is a data visualization library of Python similar to other visualization libraries like Matplotlib and Plotly. It is based on Matplotlib library. Seaborn is a powerful Python library that…
📚 Read more at Analytics Vidhya🔎 Find similar documents

Basic Seaborn Guide
Seaborn is a visualisation library that sits on top of matplotlib, making it nicer to look at and adding some extra capabilities too. Data visualisation allows data scientists to communicate their…
📚 Read more at Towards Data Science🔎 Find similar documents

Seaborn Ultimate Cheat Sheet (2021)
Seaborn is a library for creating beautiful visualizations in Python. It is built on top of matplotlib and provides a high-level API for drawing pretty statistical graphs. At first, using the library…...
📚 Read more at Level Up Coding🔎 Find similar documents
Data Visualization using Seaborn
Seaborn is a Python data visualization library based on matplotlib. It provides a high-level interface for drawing attractive and informative statistical graphics. Note: This article assumes you are…
📚 Read more at Towards Data Science🔎 Find similar documents

Seaborn: Python
Seaborn is a data visualization library built on top of matplotlib and closely integrated with pandas data structures in Python. Visualization is the central part of Seaborn which helps in…
📚 Read more at Towards Data Science🔎 Find similar documents

Seaborn 0.11 Just Released with Great New Features
Seaborn is a high-level Python data visualization library built on Matplotlib. It makes it convenient to create many different informative statistical visualizations. The new version (0.11.0) of…
📚 Read more at Towards Data Science🔎 Find similar documents

How to use Seaborn for Data Visualization
Seaborn is an open-source Python library built on top of matplotlib. It is used for data visualization and exploratory data analysis. Seaborn works easily with dataframes and the Pandas library. The…
📚 Read more at Towards Data Science🔎 Find similar documents

Plotting charts with Seaborn
Seaborn is a powerful Python library which was created for enhancing data visualizations. It provides a large number of high-level interfaces to Matplotlib. Seaborn works well with dataframes while…
📚 Read more at Towards Data Science🔎 Find similar documents

Plotting with Seaborn: Part 1
Seaborn is a library for making statistical graphics in Python. It builds on top of matplotlib and integrates closely with pandas data structures. Seaborn helps you explore and understand your data…
📚 Read more at Analytics Vidhya🔎 Find similar documents

Visualize Distributions with Seaborn
Seaborn is an incredible Python data visualization library built on-top of matplotlib. It provides a high-level interface for drawing attractive and informative statistical graphics.
📚 Read more at Analytics Vidhya🔎 Find similar documents
10 Must-Know Seaborn Visualizations
Seaborn — a popular data visualization library in Python. Seaborn is built on top of Matplotlib and is designed to make it easier …
📚 Read more at Level Up Coding🔎 Find similar documents

Matplotlib/seaborn basics
Seaborn is a Python data visualization library based on matplotlib (it is the go to library for plotting in Python). Seaborn provides a high-level interface for drawing attractive and informative…
📚 Read more at Towards Data Science🔎 Find similar documents