Seaborn
Seaborn is a powerful Python data visualization library built on top of Matplotlib, designed to enhance the aesthetics and functionality of statistical graphics. It provides a high-level interface for creating informative and attractive visualizations, making it easier for data scientists to explore and understand complex datasets. Seaborn is particularly well-integrated with Pandas data structures, allowing for seamless data manipulation and visualization. With features like automatic estimation of linear regression plots, multi-plot grids, and various plot types such as heatmaps and distribution plots, Seaborn is an essential tool for anyone looking to communicate data insights effectively.
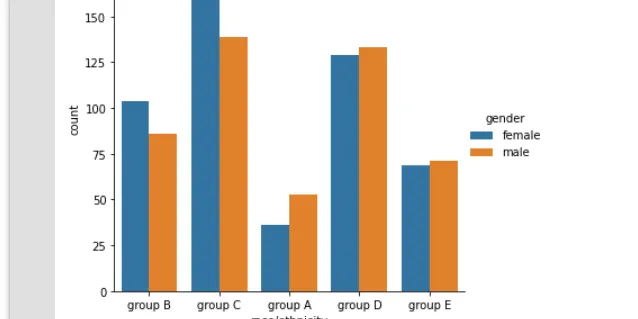
Categorical Plots in Seaborn
Seaborn is a data visualization library of Python similar to other visualization libraries like Matplotlib and Plotly. It is based on Matplotlib library. Seaborn is a powerful Python library that…
📚 Read more at Analytics Vidhya🔎 Find similar documents

Basic Seaborn Guide
Seaborn is a visualisation library that sits on top of matplotlib, making it nicer to look at and adding some extra capabilities too. Data visualisation allows data scientists to communicate their…
📚 Read more at Towards Data Science🔎 Find similar documents
Seaborn Ultimate Cheat Sheet (2021)
Seaborn is a library for creating beautiful visualizations in Python. It is built on top of matplotlib and provides a high-level API for drawing pretty statistical graphs. At first, using the library…...
📚 Read more at Level Up Coding🔎 Find similar documents
Data Visualization using Seaborn
Seaborn is a Python data visualization library based on matplotlib. It provides a high-level interface for drawing attractive and informative statistical graphics. Note: This article assumes you are…
📚 Read more at Towards Data Science🔎 Find similar documents

Seaborn: Python
Seaborn is a data visualization library built on top of matplotlib and closely integrated with pandas data structures in Python. Visualization is the central part of Seaborn which helps in…
📚 Read more at Towards Data Science🔎 Find similar documents
Seaborn 0.11 Just Released with Great New Features
Seaborn is a high-level Python data visualization library built on Matplotlib. It makes it convenient to create many different informative statistical visualizations. The new version (0.11.0) of…
📚 Read more at Towards Data Science🔎 Find similar documents
How to use Seaborn for Data Visualization
Seaborn is an open-source Python library built on top of matplotlib. It is used for data visualization and exploratory data analysis. Seaborn works easily with dataframes and the Pandas library. The…
📚 Read more at Towards Data Science🔎 Find similar documents

Plotting charts with Seaborn
Seaborn is a powerful Python library which was created for enhancing data visualizations. It provides a large number of high-level interfaces to Matplotlib. Seaborn works well with dataframes while…
📚 Read more at Towards Data Science🔎 Find similar documents
Plotting with Seaborn: Part 1
Seaborn is a library for making statistical graphics in Python. It builds on top of matplotlib and integrates closely with pandas data structures. Seaborn helps you explore and understand your data…
📚 Read more at Analytics Vidhya🔎 Find similar documents

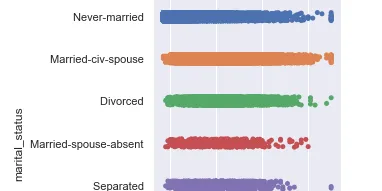
Visualize Distributions with Seaborn
Seaborn is an incredible Python data visualization library built on-top of matplotlib. It provides a high-level interface for drawing attractive and informative statistical graphics.
📚 Read more at Analytics Vidhya🔎 Find similar documents
10 Must-Know Seaborn Visualizations
Seaborn — a popular data visualization library in Python. Seaborn is built on top of Matplotlib and is designed to make it easier …
📚 Read more at Level Up Coding🔎 Find similar documents
Matplotlib/seaborn basics
Seaborn is a Python data visualization library based on matplotlib (it is the go to library for plotting in Python). Seaborn provides a high-level interface for drawing attractive and informative…
📚 Read more at Towards Data Science🔎 Find similar documents